Article of the Week about
| The metadata subpage is missing. You can start it via filling in this form or by following the instructions that come up after clicking on the [show] link to the right.
|
Do you see this on PREVIEW? then SAVE! before following a link.
A - For a New Cluster use the following directions
Subpages format requires a metadata page.
Using the following instructions will complete the process of creating this article's subpages.
- Click the blue "metadata template" link below to create the page.
- On the edit page that appears paste in the article's title across from "
pagename =".
- You might also fill out the checklist part of the form. Ignore the rest.
- For background, see Using the Subpages template Don't worry--you'll get the hang of it right away.
- Remember to hit Save!
 the "metadata template". the "metadata template".
However, you can create articles without subpages. Just delete the {{subpages}} template from the top of this page and this prompt will disappear. :) Don't feel obligated to use subpages, it's more important that you write sentences, which you can always do without writing fancy code.
|
B - For a Cluster Move use the following directions
The metadata template should be moved to the new name as the first step. Please revert this move and start by using the Move Cluster link at the top left of the talk page.
The name prior to this move can be found at the following link.
|
|
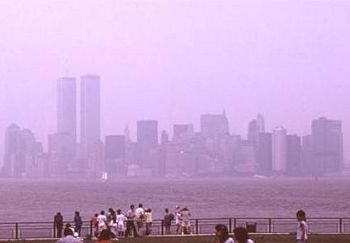 (PD) Photo: Dr. Edwin P. Ewing, Jr. / Centers for Disease Control and Prevention (CDC) Smog over New York skyline in 1988 Smog is the hazy, unhealthy polluted air that accumulates over cities and other regions under certain conditions.
Modern smog is derived primarily from precursor chemical pollutants, emitted to the atmosphere from vehicular internal combustion engines and industrial plants, that react in the atmosphere with sunlight to produce secondary chemical pollutants that also combine with the precursor emissions to form the components of what is called photochemical smog.
Origin of the term "smog"
The word smog is a blend of the words smoke and fog. Coinage of the term is generally attributed to Dr. Henry Antoine des Voeux in his 1905 paper, "Fog and Smoke" for a meeting of the Public Health Congress in London, United Kingdom. The July 26, 1905 edition of the Daily Graphic, a London newspaper, quoted des Voeux: "... he said it required no science to see that there was something produced in great cities which was not found in the country, and that was smoky fog, or what was known as 'smog'." [1] The next day, the Globe newspaper remarked that "Dr. des Voeux did a public service in coining a new word for the London fog.">[1]
Photochemical smog
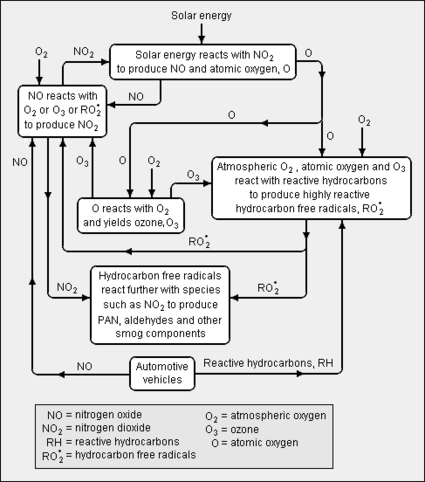 (CC) Diagram: Milton Beychok Atmospheric chemistry involved in smog formation [2][3][4][5] Originally, Dr. des Voeux's term smog referred to a mixture of smoke, sulfur dioxide (SO2) and fog that was once prevalent in London when coal with a high sulphur content was widely used throughout the city as heating fuel. The dark, sulfurous London smog caused reduced visibility, respiratory problems and had a noticeable deleterious affect on human health. The Great Smog of 1952 darkened the streets of London and killed approximately 4,000 people in a 4-day period (another 8,000 died from its effects in the following months)[6] The type of smog experienced in London many decades ago is no longer encountered since other fuels have largely replaced the wide-spread use of high-sulfur coal for heating.
Photochemical smog is chemically quite different than the old London-type smog and has a long history. In 1542, when exploring what is now Southern California, Juan Rodriguez Cabrillo named San Pedro Bay the "Bay of Smokes" because of the thick haze that covered the area. Complaints of eye irritation from the polluted air in Los Angeles date back to the late 1860s. In the 1940s, photochemical smog first became apparent in Los Angeles and other large cities on sunny days, although none of those cities had any significant use of coal for heating fuel or for industrial activities.[2][3][4][7]
Photochemical smog is a daytime phenomenon that occurs mostly during warm, sunny summertime days and is characterized by a brown haze that reduces visibility and contains oxidants, such as ozone (O3), that cause respiratory problems, eye irritation and damage to plants. It is a mixture of variable amounts of ozone, reactive hydrocarbons, nitrogen oxide (NO), nitrogen dioxide (NO2), aldehydes, peroxyacetyl nitrate (PAN), particulate matter and other components. By contrast, the London-type smog (also referred to as "classic smog") occurs mostly during cold winter days and consists primarily of a mixture of sulfur dioxide and particulate matter (i.e., "soot") usually derived from burning coal.[8]
Photochemical smog precursor pollutants
The chemistry involved in the formation of smog is highly complex and involves many different reactions (see the adjacent diagram). The three major ingredients required to form photochemical smog are solar energy (i.e., sunlight), reactive hydrocarbons and nitrogen oxide, the latter two being referred to as the precursor pollutants. As shown in the diagram, the two precursors enter the atmosphere as gases emitted for the most part from vehicular internal combustion engines fuelled by gasoline and diesel oil. To a much lesser extent, nitrogen oxide is also emitted from industrial combustion sources, and reactive hydrocarbons are emitted by evaporation from the handling and storage of volatile hydrocarbons[9] such as gasoline, solvents, some pesticides and some paints. Biogenic sources such as pine trees and certain other trees are also a source, though of relatively minor importance, of reactive hydrocarbon emissions such as isoprene and α-pinene.
Simplified chemistry of photochemical smog formation
In the simplified schematic overview depicted in the adjacent diagram, the major chemical reactions that contribute to the formation of photochemical smog include the following:[2][3][4][5][10]
- The gaseous precursor nitrogen oxide, emitted primarily from vehicular internal combustion engines, is oxidized to produce gaseous nitrogen dioxide.
- nitrogen oxide + oxygen
 nitrogen dioxide nitrogen dioxide
- 2NO(g) + O2(g)
 2NO2(g) 2NO2(g)
- The gaseous nitrogen dioxide is broken down by solar energy from sunlight to produce gaseous nitrogen oxide and atomic oxygen (O, an oxygen radical). This process is referred to as photolysis and hence the term "photochemical smog".
- nitrogen dioxide +solar energy
 nitrogen oxide + atomic oxygen nitrogen oxide + atomic oxygen
- NO2(g) + solar energy
 NO (g) + O NO (g) + O
- The atomic oxygen reacts with gaseous atmospheric oxygen (O2)[11] to form gaseous ozone (O3).
- atomic oxygen + atmospheric oxygen
 ozone ozone
- O + O2(g)
 O3(g) O3(g)
- The gaseous ozone also oxidizes gaseous nitrogen oxide to form gaseous nitrogen dioxide and gaseous oxygen.
- ozone + nitrogen oxide
 nitrogen dioxide + oxygen nitrogen dioxide + oxygen
- O3(g) + NO(g)
 NO2(g) + O2(g) NO2(g) + O2(g)
- The gaseous precursor reactive hydrocarbons (RH), emitted primarily from vehicular internal combustion engines, reacts with atomic oxygen, atmospheric oxygen and ozone to produce various highly reactive hydrocarbon free radicals (RO•2).
- The hydrocarbon free radicals then react with other species such as nitrogen dioxide to form peroxyacetyl nitrate (PAN),[12] aldehydes and other smog components.
- Nitrogen dioxide + oxygen + hydrocarbon free radicals
 peroxyacetyl nitrate peroxyacetyl nitrate
- 2NO2(g) + O2(g) + 2RO•2
 2CH3CO–OO–NO2(g) 2CH3CO–OO–NO2(g)
The various products produced or formed from the precursor pollutants are referred to as secondary pollutants. All of the above chemical reactions (as well as others) occur more or less simultaneously during sunny, summertime days in most large cities with a great number of automobiles and other vehicles.
Health effects
- For more information, see: Air Quality Index.
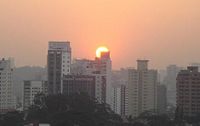 (CC) Photo: Carol Sawada Smog in São Paulo, Brazil in 2006.
United States' AQI[13]
Air Quality
Index
(AQI) |
Air Quality
Category |
Color
Code
|
| 0 – 50 |
Good |
|
| 51 – 100 |
Moderate |
|
| 101 – 150 |
Unhealthy for
Sensitive Groups |
|
| 151 – 200 |
Unhealthy |
|
| 201 – 300 |
Very Unhealthy |
|
| 301 – 500 |
Hazardous |
|
Photochemical smog constitutes a serious health problem in most large cities. It is especially harmful for senior citizens, children, and people with heart and lung conditions such as emphysema, bronchitis, and asthma. It can inflame breathing passages, decrease the lungs' working capacity, cause shortness of breath, pain when inhaling deeply, wheezing, and coughing. It can cause eye and nose irritation and it dries out the protective membranes of the nose and throat. In general, it interferes with the body's ability to fight infection, thereby increasing susceptibility to illness.[14][15]
The adjacent table explains the Air Quality Index (AQI) ranges used by the U.S. Environmental Protection Agency (U.S. EPA) and their corresponding health effect categories and color codes. The U.S. EPA's AQI is also known as the Pollution Standards Index (PSI). A national map of the United States of America containing daily AQI forecasts across the nation, using that same color-coding, is published online jointly by the U.S. EPA and the National Oceanic and Atmospheric Administration (NOAA).[16]
If multiple pollutants are measured at a monitoring site, then the largest or "dominant" AQI value is reported for the location.
The U.S. EPA has developed conversion calculators, available online,[17][18] for the conversion of AQI values to concentration values and for the reverse conversion of concentrations to AQI values.
The South Coast Air Quality Management District (SCAQMD) of Southern California has published an excellent, comprehensive discussion of the undesirable health effects caused by air pollution. It also includes an extensive listing and discussion of the many medical health effect studies of pollution performed during the past decades starting around 1950.[15]
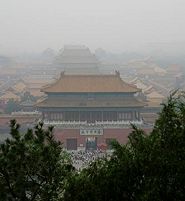 (CC) Photo: Brian Jeffrey Beggerly Smog over Beijing in 2005. Areas affected
Smog can form in almost any location where the level of air pollutants is high, and ii is more likely to occur during periods of warm, sunny weather when the upper air is warm enough to inhibit vertical circulation. It often persists for extended time periods over densely populated cities, such as Athens, Beijing, Berlin, Cairo, Hong Kong, Kuala Lumpur, London, United Kingdom, Los Angeles, Milan, Moscow, New York, Paris, Rome, São Paulo, Seoul and Shanghai. Smog is especially prevalent in geologic basins encircled by hills or mountains.
England
In 1306, concerns over air pollution were sufficient for Edward I to briefly ban coal fires in London.[19] In 1661, John Evelyn, the noted English diarist of his day, published Fumifugium in which he suggested the widespread planting of fragrant trees, shrubs and flowers around London so as to counteract the foul effects of the smoke from coal-burning.[20] Two years later, in 1663, a satirical poem known as the Ballad of Gresham College commemorates Evelyn's book by this verse:[21]
- "He shewes that 't is the seacoale smoake,
- That allways London doth Inviron,
- Which doth our Lungs and Spiritts choake,
- Our hanging spoyle, and rust our Iron."
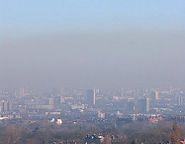 (CC) Photo: Jim Budd Smog over London in 2007 In the 1800s, more than a million London residents were burning coal, and winter "fogs" became more than a nuisance. An 1873 coal-smoke saturated fog, thicker and more persistent than natural fog, hovered over the city for days. As now known from subsequent epidemiological findings, the fog caused 268 deaths from bronchitis. Another fog in 1879 lasted from November to March, four long months darkened skies and gloom. Severe episodes of smog continued even into the 20th centuries and were nicknamed "pea-soupers".[22]
As discussed earlier above, the Great Smog of 1952 killed approximately 4,000 people in the short time of 4 days and a further 8,000 died from its effects in the following months. That finally prompted real legislative reform. In 1956, the Clean Air Act 1956, sponsored by the Ministry of Housing and Local Government in England and the Department of Health in Scotland, was enacted by the Parliament of the United Kingdom and introduced smokeless zones in London. It was in effect until 1964 and consequently reduced the sulfur dioxide levels in London's air to the point that made the intense and persistent London smog a thing of the past. It was after this that the great clean-up of London began and buildings recovered their original clean stone façades which, during two centuries, had gradually blackened.
However, as clearly shown in the adjacent photograph, photochemical smog still does occur in modern London.
European Union
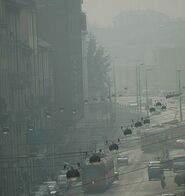 (CC) Photo: Andrea Squatrito Smog in Milan in 2006. The European Union (EU) is composed of 27 member states[23] and was established by the Treaty of Maastricht in 1993. Its executive functions are performed by the European Commission and to a limited extent by the European Council.
The large cities within the EU, such as Athens, Berlin, Milan, Paris, Rome and others, all experience episodes of photochemical smog in varying degrees of severity and especially so in the summer months. For example, see the adjacent photograph of smog in Milan.
The EU uses the ground-level atmospheric ozone concentration as an indicator of air quality and has adopted these limiting ozone values:[24][25]
Target value (TV): 120 µg/m3 for 1 hour averaging time for 8-hour average, daily maximum. Not to be exceeded more than 25 days per year. Defined as the target value for the protection of human health.
Information threshold (IT): 180 µg/m3 for 1 hour averaging time. Defined as the level beyond which there is a risk to human health from brief exposure for particularly sensitive sections of the population. Any exceedance of this threshold should be reported by the member state in which it occurs to the European Commission.
Alert threshold (IT): 240 µg/m3 for 1 hour averaging time. Defined as the level beyond which there is a risk to human health from brief exposure for the general population. If exceeded in a member state, national authorities of the member state are required to warn the public and give advice.
According to a recent report by the European Environmental Agency (EEA),[26] the overall area of the EU that experiences exceedances of the ozone target value has declined by 60% during the period from 2006 − 2009. The executive summary of that report states: In contrast to previous summers, in 2009 there were no pan-European multi-day episodes. Summer 2009 was characterized by ozone episodes of two to five days followed by spells with few exceedances. However, the executive summary also states that a significant area of the EU still experienced exceedance of the ozone target value.
Russia
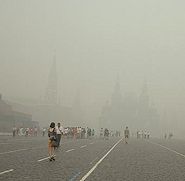 (CC) Photo: Yulia Smirnova Smog in Moscow in 2010 In early August 2010, the city of Moscow was covered by a heavy, dark smog caused by extensive wildfires across much of western Russia., turning the city's buildings into blurs, grounding air flights, and forcing the city's residents and tourists to wear surgical masks.[27] At the beginning of August, forest fires in Russia exceeded 100, 000 hectares which by August 21 had decreased to 7,000 hectares according to the Emergencies Ministry.[28]
The head of the Moscow's health department said that the abnormal heat and smog coming from fires had seriously exacerbated the environmental conditions in Moscow and “The death rate has doubled in the city. The regular daily death rate in Moscow is 360 – 380. We had about 700 deaths today." [28]
Some airborne pollutants were four times higher than normal, the worst concentrations seen to date according to city health officials. The concentrations appeared likely to get even worse as the state news agency, ITAR - Tass, reported that the smoke was thickening.[27]
Ruhr Valley Incident of 1985
The Ruhr district, located in the Rhine river valley of western Germany, is an urban area in the state of North Rhine-Westphalia]. With a population of about 7 million (2008) and an area of 4,435 square kilometers (1,713 square miles), it is the largest urban area in Germany. Historically, it has been a heavily industrialized area that experienced decades of polluted air containing smoke and high amounts of sulfur dioxide — the key ingredients of London-type smog.
In January of 1985, the Ruhr district experienced an extended episode of London-type smog that lasted 5 days with the 24-hour averages of sulfur dioxide in the air as high as 0.8 mg/m3 and particulate matter as high as 0.6 mg/m3, both primarily derived from the extensive burning of coal by the area's steel mills and other industries. In the 5 days of the episode, the daily death rate increased by 8% and the hospital admissions for respiratory and cardiovascular problems increased by 15%.[29][30]
During the smog episode, a smog alarm was called, personal automobile driving was banned and many schools were closed.[31]
Iran
In December 2005, schools and public offices had to close in Tehran, Iran, and 1600 people were taken to hospital, in a severe smog blamed largely on automobile exhausts.[32]
Mexico
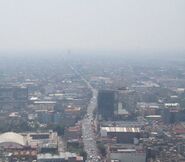 (CC) Photo: Lauren Brown Mexico City smog in 2006 Mexico City is located in the tropical latitudes on a high plain at an altitude of 2,200 meters, and is surrounded on three sides by mountains that reach elevations of 5,000 meters. The major sources of air pollutants within Mexico City's urban area include exhaust from 3.5 million vehicles, thousands of industries, and mineral dust. The ancient lakebed valley in which the city is situated became a major source of dust when it was drained in the 16th century.[33] The area is known as the Valley of Mexico, sometimes called the Bowl of Mexico.
Due to its location in a highland bowl, cold air sinks down onto the urban area of Mexico City, trapping industrial and vehicle pollution underneath and, as a result, the city has one of the world's worst air pollution problems. Within one generation, the city has changed from being known for some of the cleanest air of the world into one with some of the worst pollution, with pollutants like nitrogen dioxide measured at twice or thrice the level of international standards.[34] Since solar radiation does not vary significantly with season at tropical latitudes, photochemical smog is present over the city much of the year.[33]
Southeast Asia
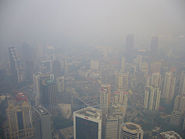 (CC) Photo: Thomas Galvez Haze and smoke in Kuala Lumpur, Malaysia in 2006 Southeast Asia consists of a mainland section and a maritime section. The mainland section includes Mayanmar,[35] Cambodia, Laos, Thailand, Vietnam and Peninsular Malaysia and the maritime section includes Brunei, East Malaysia, East Timor, Indonesia, Philippines, and Singapore.[36] The large cities in Southeast Asia have been plagued by smoky haze and photochemical smog ever since the late 1990s. The primary cause of the smoky haze have been the extensive forest fires occurring in Indonesia.[37] Farmers and plantation owners are said to be responsible for the fires, which they use to clear tracts of land for further plantings. Other contributing factor are that El Niño conditions have created some very dry seasons with very little rainfall and the peat swamps that underlie the Indonesian forests and add fuel to the fires.
One of the recent major occurrences of smoky haze in Malaysia, Singapore and other parts of Southeast Asia occurred in October 2006 and was caused by smoke from forest fires in Indonesia being blown across the Straits of Malacca by south-westerly winds.
Since December 1997, member countries of the Association of Southeast Asia Nations (ASEAN) have been undertaking joint efforts in monitoring, preventing and mitigating transboundary haze pollution resulting from land and forest fires, guided by the Regional Haze Action Plan (RHAP) that was endorsed by the ASEAN Environment Ministers. In addition, the ASEAN Agreement on Transboundary Haze Pollution (or ASEAN Haze Agreement) was adopted in June2002 and comprehensively addresses all aspects of fire and haze including prevention, emphasizing the underlying causes, monitoring, and mitigation.[38]
In addition to the smoky haze caused by the forest fires, they have resulted in large amounts of the photochemical smog precursor, nitrogen oxide, entering the atmosphere. That, coupled with the great numbers of automobiles and other vehicles used in the large cities of Southeast Asia, has resulted in those cities being subjected to photochemical smog as well as hazy smoke.
United States
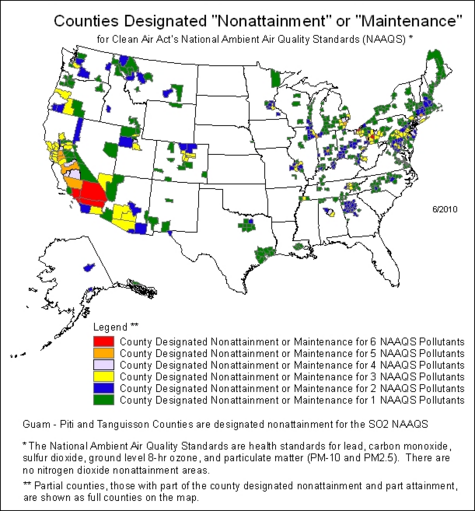
The U.S. EPA has designated over 300 U.S. counties in the United States to be "non-attainment areas" for one or more air pollutants, meaning that they have failed to attain and maintain the National Ambient Air Quality Standards as required by the Clean Air Act enacted by the U.S. Congress . The non-attainment areas are largely clustered around large metropolitan areas, with the largest contiguous non-attainment zones being in California and the Northeast, as can be seen in the map below.[39] Various U.S. and Canadian government agencies collaborate to produce real-time air quality maps and forecasts.[40]
 (PD) Image: U.S. Environmental Protection Agency Los Angeles and the San Joaquin Valley
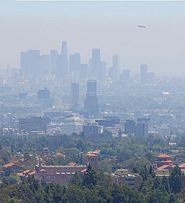 (PD) Photo: Jon Sullivan, www.pdphoto.org Los Angeles smog in 2003. Located in low basins surrounded by mountains, Los Angeles and the San Joaquin Valley are known for their photochemical smog. The millions of vehicles in these basins, plus the added effects of the port complex in Los Angeles, result in the accumulation of photochemical smog precursors and subsequently to the formation of photochemical smog. Strict regulations by the California Air Resources Board and other California government agencies overseeing this problem have reduced the number of smog alerts from several hundred annually to just a few. However, these geographically predisposed smog areas still have air pollution levels that are a pressing issue for the more than 25 million people who live there.
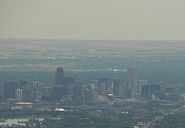 (CC) Photo: Rick Kimpel Denver smog in 2006. Denver
Denver, the "Mile High City" suffers from frequent smogs that are made worse by its location in the Rocky Mountains.
Because of Denver's high altitude, it has frequent temperature inversions when warm polluted air is trapped underneath a layer of cold air and cannot rise and disperse [41] more widely. As a result, photochemical smog may envelope the city for many days at a time (see adjacent photo).[42]
In the past, Denver regularly failed to meet the federal National Ambient Air Quality Standards for air quality on dozens of days each year and the city has worked diligently to solve its air pollution problem. In 2007, the U.S. EPA noted that Denver was ahead of its schedule for reducing smog. Yet, Denver still exceeds the federal standards for several days a year.[42]
Major incidents in the United States
- 1948, October, Donora, Pennsylvania: 20 killed by smog, 600 hospitalized, thousands more stricken.[43]
- 1953, November, New York: Smog kills between 170 and 260 people.[43]
- 1954, October, Los Angeles: Heavy smog shuts down schools and industry for most of the month.[43]
- 1963, New York: Smog caused 200 deaths[44]
- 1966, New York: Smog caused 168 deaths[44]
References
- ↑ 1.0 1.1 Beatrice Trum Hunter (2004). Air and Your Health. Basic Health Publications, page 82. ISBN 1-59120-057-1.
- ↑ 2.0 2.1 2.2 Stanley E. Manahan (2006). Environmental Science and Technology: A Sustainable Approach to Green Science and Technology, 2nd Edition. CRC Press. ISBN 0-8493-9512-7.
- ↑ 3.0 3.1 3.2 G.S. Sodhi (2005). Fundamental Concepts of Environmental Chemistry, 2nd Edition. Alpha Science International. ISBN 1-84265-218-8.
- ↑ 4.0 4.1 4.2 The Chemistry of Photochemical Smog From the website of AUS-e-TUTE, an Australian interactive learning resource.
- ↑ 5.0 5.1 Photochemical Smog From the website of Middle Tennessee State University (MTSU)
- ↑ Michelle L. Bell, Devra L. Davis and Tony Fletcher (January 2004). "A Retrospective Assessment of Mortality from the London Smog Episode of 1959: The Role of Influenza and Pollution". Environmental Health Perspectives 112 (1): 6–8.
- ↑ Smog From the website of Pollution Issues
- ↑ R.B. Singh (2006). Sustainable Urban Development. Concept Publishing, pp. 59-60. ISBN 81-8069-295-7.
- ↑ Note: Also referred to as volatile organic compounds (VOC)
- ↑ Photochemical smog - what it means for us The Environmental Protection Authority of South Australia
- ↑ Note: May also be referred to as molecular oxygen
- ↑ Formula of peroxyacetyl nitrate: C2H3NO5
- ↑ Air Quality Index (AQI) - A Guide to Air Quality and Your Health From the AIRNow web site jointly maintained by the U.S. EPA, National Oceanic and Atmospheric Administration, National Park Service, tribal, state, and local agencies
- ↑ Smog - Who does it hurt? From the AIRNow web site jointly maintained by the U.S. EPA, National Oceanic and Atmospheric Administration, National Park Service, tribal, state, and local agencies.
- ↑ 15.0 15.1 Smog and Health From the website of the South Coast Air Quality Management District (SCAQMD).
- ↑ Today's National Air Quality Forecast
- ↑ AQI Calculator: AQI to Concentration
- ↑ AQI Calculator: Concentration to AQI
- ↑ Barbara Freese (2003). Coal: A Human History, Ist Edition. Perseus Publishing, p.1. ISBN 0-7382-0400-5.
- ↑ John Evelyn (1661). Fumifugium; or the Inconvenience of the Air and Smoke of London Dissipated, Ist Edition. Gabriel Bedel and Thomas Collins, London. The full text is available online at The Internet Archive
- ↑ Fog and Filthy Air From the website of the Meteo Group in the United Kingdom]].
- ↑ London's Historic "Pea-Soupers"] by David Urbinato.1994, (from the website of the U.S. EPA).
- ↑ Note: The EU member states are: Austria, Belgium, Bulgaria, [[Cyprus, the Czech Republic, Denmark, Estonia, Finland, France, Germany, [[Greece], Hungary, Ireland, Italy, Latvia, Lithuania, Luxembourg, Malta, the Netherlands, Poland, Portugal, Romania, Slovakia, Slovenia, Spain, Sweden, and the United Kingdom
- ↑ Air pollution by ozone across Europe during summer 2009 Table 1.1 of European Environmental Agency (EEA) Technical report No 2/2009, Overview of exceedances of European Commission(EC) ozone threshold values for April–September 2009
- ↑ Note: Directive 2002/3/EC of 2002. Although Directive 2008/50/EC, which came into force in June 2010, repealed the 2002 Directive, it did not change the Target, Information, and Alert thresholds defined in the 2002 Directive.
- ↑ Air pollution by ozone across Europe during summer 2009 Table 2.5 of European Environmental Agency (EEA) Technical report No 2/2009, Overview of exceedances of European Commission(EC) ozone threshold values for April–September 2009
- ↑ 27.0 27.1 Fires lay ghostly shroud of smoke on Moscow, Jim Heintz, Associated Press, August 6, 2010
- ↑ 28.0 28.1 News report of ITAR-Tass The state news agency of Russia
- ↑ What can we learn today from the Central European smog episode of 1985 (and earlier episodes)? From the website of PubMed.gov.
- ↑ Health Effects During a Smog Episode in West Germany in 1985 E. Wichmann et al, 1988
- ↑ 1985, Environment, Phase III smog alarm, produced by the Landeszentrale für politische Bildung — State Center for Political Education, North Rhine – Westphalia (NRW). Click on 1985 in the right hand column.
- ↑ Hundreds treated over Tehran smog, BBC News, December 10, 2005.
- ↑ 33.0 33.1 A Hazy Day in Mexico City From the website of NASA.
- ↑ Air pollution in Mexico City] by Maricela Yip and Pierre Madl, December 14, 2000, University of Salzburg, Austria
- ↑ Also known as Burma. However, Myanmar is the country's name as recognized by the United Nations.
- ↑ World Macro Regions and Components] From the United Nations website.
- ↑ Mark E. Harrison, Susan E. Page and Suwido H. Limin (August 2009). "The global impact of Indonesian forest fires". Biologist 56 (3): 156-163.
- ↑ Combating Haze in ASEAN: Frequently Asked Questions From the website of the ASEAN.
- ↑ EPA Green Book, Counties Designated Non-attainment and Maintenance
- ↑ Airnow.gov
- ↑ Milton R. Beychok (2005). Fundamentals Of Stack Gas Dispersion, 4th Edition. Author-published. ISBN 0-9644588-0-2.
- ↑ 42.0 42.1 Stanley D. Bruun, Maureen Hays-Mitchell, Donald J. Ziegler and Ellen R. White (2008). Cities of the World: World Regional Urban Development, 4th Edition. Rowman & Littlefield Publishers, p. 99. ISBN 0-7425-5597-6.
- ↑ 43.0 43.1 43.2 Environmental History Timeline: 1940-1960 From the website of Radford University in Virginia.
- ↑ 44.0 44.1 Arnold W. Reitze Jr. (2001). Air Pollution Control Law: Compliance and Enforcement, 1st Edition, pp. 14-15. ISBN 1-58576-027-7.
|