National Ambient Air Quality Standards
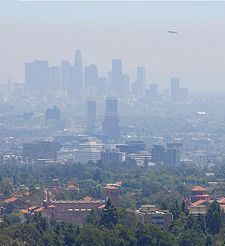
The U.S. Clean Air Act,[1] enacted by the U.S. Congress and last amended in 1990,[2] required the U.S. Environmental Protection Agency (U.S. EPA) to set air pollutant concentration limits as National Ambient Air Quality Standards (NAAQS)[3][4] for outdoor ambient air pollutants considered harmful to public health and the environment.
The Clean Air Act established two types of national air quality standards. Primary standards that define air pollutant concentration limits intended to protect the public health, including the health of sensitive populations such as asthmatics, children and the elderly. Secondary standards that define limits intended to protect the public welfare and environment, including damage to animals, crops, vegetation and buildings as well as providing protection against decreased visibility.[3]
The Clean Air Act requires periodic review of the science upon which the standards are based and the standards themselves.
Worldwide, other air quality standards have been adopted, such as European Union Air Quality Directive,[5] the UK Air Quality Strategy,[6] and the World Health Organization (WHO) Air Quality Guidelines.[7]
Summary of the NAAQS
- See also: Air Quality Index
The NAAQS set air pollutant concentration limits for six pollutants, called the criteria air pollutants, namely carbon monoxide (CO), sulfur dioxide (SO2), nitrogen dioxide (NO2), ozone (O3), lead (Pb), Particulate Matter (PM10)[8] and Particulate Matter (PM2.5).[8]
The NAAQS for the six criteria pollutants are listed in the table below:
| Primary Standard | Secondary Standard | |||
|---|---|---|---|---|
| Criteria Pollutant |
Concentration Limit |
Averaging Time |
Concentration Limit |
Averaging Time |
| Carbon monoxide | 9 ppmv ( 10 mg/m3 ) |
8-hour (1) | None | |
| 35 ppmv ( 40 mg/m3 ) |
1-hour (1) | |||
| Sulfur dioxide | 0.03 ppmv ( 80 μg/m3 ) |
Annual (arithmetic mean) |
0.5 ppmv ( 1300 μg/m3 ) |
3-hour (1) |
| 0.14 ppmv ( 365 μg/m3 |
24-hour (1) | |||
| Nitrogen dioxide | 0.053 ppmv ( 100 μg/m3 ) |
Annual (arithmetic mean) |
Same as primary | |
| Ozone | 0.075 ppmv ( 150 μg/m3 ) |
8-hour (2) | Same as primary | |
| 0.12 ppmv ( 235 μg/m3 ) |
1-hour (3) | Same as primary | ||
| Lead | 0.15 μg/m3 | Rolling 3-month average |
Same as primary | |
| 1.5 μg/m3 | Quarterly average | Same as primary | ||
| Particulate Matter (PM10) |
150 μg/m3 | 24-hour (4) | Same as primary | |
| Particulate Matter (PM2.5) |
15 μg/m3 | Annual (5) (arithmetic mean) |
Same as primary | |
| 35 μg/m3 | 24-hour (6) | Same as primary | ||
| (1) Not to be exceeded more than once per year. (2) The 3-year average of the fourth-highest daily maximum 8-hour average at each monitor within | ||||
The units of measure used for concentrations in the above table are parts per million by volume (ppmv), milligrams per cubic meter of air at 101.325 kPa and 25 °C (mg/m3), and micrograms per cubic meter of air at 101.325 kPa and 25 °C (µg/m3). See Air pollutant concentrations for the conversions between gas concentrations ppmv and mg/m3.
Air quality areas not in compliance with the NAAQS as of 2009
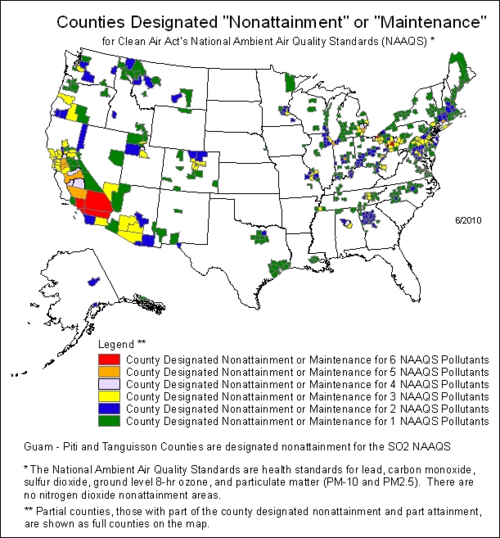
A network of about 4,000 State and Local Air Monitoring Stations (SLAMS) is used to determine if geographic areas are meeting or exceeding the NAAQS. Attainment areas are those geographic areas that stay at or below the NAAQS. Nonattainment areas are areas in which the NAAQS for a criteria pollutant are being exceeded.
The map below depicts the counties in the United States that have not attained compliance with the NAAQS standards for one or more of the criteria pollutants as of 2009:[9]
References
- ↑ Clean Air Act (The entire text as of February 24, 2004)
- ↑ Clean Air Act (From the U.S. EPA website: "Legislation passed since 1990 has made several minor changes.")
- ↑ 3.0 3.1 3.2 National Air Quality Standards As summarized on the website of the U.S. EPA
- ↑ 4.0 4.1 Full text of 40 CFR 50 Title 40 Part 50 of the United States of America Code of Federal Regulations (CFR) containing the National Ambient Air Quality Standards
- ↑ New Air Quality Directive From the European Union's website
- ↑ Air Quality Strategy from the website of the UK's Department for Environment, Food and Rural Affairs
- ↑ Air Quality Guidelines From the website of the World Health Organization
- ↑ 8.0 8.1 PM10 is particulate matter having an aerodynamic diameter of 10 μm (micrometer) or less. PM2.5 is particulate matter having an aerodynamic diameter of 2.5 μm (micrometer) or less.
- ↑ Counties Designated As Nonattainment Areas
- CZ Live
- Earth Sciences Workgroup
- Engineering Workgroup
- Health Sciences Workgroup
- Chemical Engineering Subgroup
- Environmental Engineering Subgroup
- Articles written in American English
- Advanced Articles written in American English
- All Content
- Earth Sciences Content
- Engineering Content
- Health Sciences Content
- Chemical Engineering tag
- Environmental Engineering tag

