Acid rain
Acid rain is a popular term for the atmospheric deposition of acidified precipitation, including rain, snow, sleet, hail and particulates, as well as acidified fog and cloud water.[1] The increased acidity of these depositions, primarily from sulfuric and nitric acids, is generated as a by-product of the combustion of fuels,[2] especially in fossil fuel power plants. The heating of homes, electricity production, and driving vehicles all rely primarily on fossil fuel energy. When fossil fuels are burned, acid-forming nitrogen oxides and sulfur oxides are released to the atmosphere. These chemical compounds are transformed in the atmosphere, often traveling thousands of kilometers from their original source, and then fall out on land and water surfaces as acid rain. As a result, air pollutants from power plants in the states of New Jersey or Michigan can impact pristine forests or lakes in undeveloped parts of the states of New Hampshire or Maine.[3]
Acid rain in North America was discovered in 1963 in rain at the Hubbard Brook Experimental Forest (HBEF)[4] that was some 100 times more acidic than unpolluted rain. Innovations for reducing fossil fuel combustion emissions, such as scrubbers upstream of the tall flue gas stacks on power plants and other industrial facilities, catalytic converters on automobiles, and use of low-sulphur coal, have been employed to reduce emissions of sulfur dioxide (SO2) and nitrogen oxides (NOx).
The examples in this article mainly describe the North American situation, but the nature and effects of acid rain are similar all over the world.
Terminology
The following definitions describe the technical terms that have a special meaning to the study or discussion of acid rain:[3][5]
Acid rain: A broad term that includes both wet and dry deposition of material from the atmosphere which contain higher than normal amounts of acids (predominantly sulfuric acid and nitric acid).
Wet deposition: A term that refers to acidic rain, snow, fog, or mist that falls onto the ground from the atmosphere.
Dry deposition: A term that refers to the acids that may become incorporated into the dust and other particulates in the atmosphere and fall onto the ground, buildings, homes, cars, and trees. Dry deposition is washed from these surfaces by rainstorms, causing an increase in the acidity of the runoff water. Dry deposition is difficult to quantify but has been estimated to represent 20% to 80% of the total acid deposition, depending on location, season, and total rainfall.[3]
Precipitation: A term that refers to either or both wet and dry deposition.
Acids: A term that refers to the acids found in acid rain. The atmosphere contains acid precursors (chemical forerunners) such as gaseous sulfur dioxide and nitrogen oxides that originate from natural sources as well as man-made (anthropogenic) sources. Those gases react with water and oxygen in the atmosphere to form mild (low concentration) solutions of sulfuric and nitric acids.
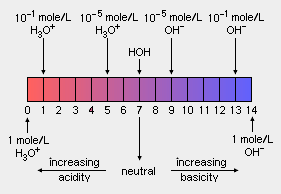
Acidity: The acidity of acid rain is measured using a scale called "pH". The lower is the pH of a substance, the higher is its acidity (i.e., the more acidic it is). As shown in the adjacent diagram, the pH scale is logarithmic and ranges from 0 (strongly acidic) to 14 (strongly alkaline or basic). Pure water has a pH of 7.0 which is considered to be "neutral", meaning that it is neither acidic or basic. However, normal rainfall is slightly acidic because carbon dioxide (CO2) in the atmosphere dissolves in the rain to form carbonic acid (H2CO3) which is weakly acidic and results in the rainfall having a pH of about 5.6.
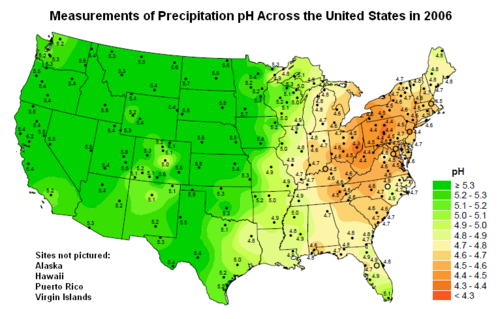
Map showing the pH of precipitation (wet deposition) across the United States of America.[6]
Precipitation mechanism
- See also: Air pollution emissions
The combustion of fossil fuels in power plants and other industrial plants produces combustion flue gases, containing acid-forming precursors such as sulfur dioxide and nitrogen oxides, that are emitted to the atmosphere.. The combustion of hydrocarbon fuels in the engines of automotive vehicles, aircraft, trains and ships also produce exhaust emissions of acid-forming precursors such as nitrogen oxides and, in some cases, sulfur dioxide. In addition to those anthropogenic (man-made) sources, natural sources such as trees, forest fires, volcanoes, and geysers also emit acid-forming nitrogen oxides.
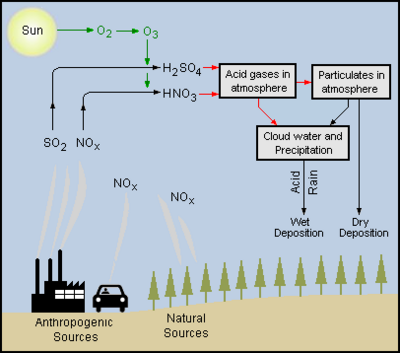
Those acid-forming precursors, sulfur dioxide and nitrogen oxides, are converted in the atmosphere by a complex series of reactions, into sulfuric acid and nitric acid.[7]
The adjacent diagram depicts the emission of acid-forming precursors into the atmosphere and their conversion into sulfuric and nitric acid as well as their subsequent wet and dry deposition.
The emission of acid-forming precursors by natural sources led to the inference that precipitation in the pre-industrial atmosphere of forested regions had a pH of about 5.0 due only to the formation of carbonic acid from the CO2 in the atmosphere as per this reaction:
- water + carbon dioxide → carbonic acid
If that inference is true, then modern precipitation in the northeastern United States of America, ranging from about 4.5 to about 4.7 (see the above pH map), is two to three times more acidic than in pre-industrial times.
Effects of acid rain on surface water acidity
Acid deposition degrades the quality of surface water by increasing the acidity (i.e., lowering the pH) of the surface water. The degree of surface water acidification is an indicator of the potential harmful effects of acid rain on the biotic ecology as well as the plant life and soil of an entire watershed area.
Surface waters become acidic when the supply of acids from atmospheric deposition and other watershed processes exceeds the capacity of watershed soils and non-acidic drainage waters to neutralize them. When acidic surface waters drain into lakes and streams, it decreases their acid-neutralizing capacity (ANC).[8] Surface waters are technically defined as being ‘acidic’ if their acid neutralizing capacity is less than 0, which corresponds to having pH values less than about 5.2.
Aluminium leaches from silicate minerals which come in contact with low-pH waters and, hence, acidic surface waters increase the aluminium content of lakes and streams. While much of the aluminium present in surface waters is organically-bound and relatively non-toxic, certain inorganic species are highly toxic.
Acidity of the lakes and streams in the United States
The National Surface Water Survey (NSWS) in the United States documented the status and extent of chronic acidification during surveys conducted from 1984 through 1988 in acid-sensitive regions throughout the United States. Many lakes and streams examined in the NSWS suffer from chronic acidity, a condition in which water has a constant low pH level. The survey investigated the effects of acidic deposition in over 1,000 lakes larger than 4 hectares (about 10 acres) and in thousands of miles of streams believed to be sensitive to acidification. Of the lakes and streams surveyed, acid rain caused acidity in 75 percent of the acidic lakes and about 50 percent of the acidic streams. Several regions in the United States were identified as containing many of the surface waters sensitive to acidification. They include the Adirondacks and Catskills in New York state, the mid-Appalachian highlands along the east coast, the upper midwest, and mountainous areas of the western United States. In areas like the northeastern United States, where the soil-buffering capacity is poor, some lakes now have a pH value of less than 5.[9][10]
Stream data from the HBEF reveal a number of long-term trends consistent with trends in lakes and streams across the northeastern United States.. Specifically, the concentration of sulfate in streams at the HBEF declined 20 percent between 1963-1994. The pH of streams subsequently increased from 4.8 to 5.0. Although this represents a significant improvement in water quality, streams at the HBEF remain acidic compared to background conditions, estimated to be above 6.0. Moreover, the ANC of the lakes and streams in the HBEF has not improved significantly over the past thirty years.
Biologically-relevant surface water chemistry
The main cause for concern about surface water acidification in the United States and elsewhere is the potential for detrimental biological affects. Typically, there is concern for biological impact if the pH is less than 6. At low pH values, aluminium may be present at concentrations that are toxic to biota, including sensitive life stages of fish and invertebrates. Aluminium is normally a harmless component of silicate minerals in rocks and soils. However, when silicate minerals come in contact with low-pH waters, aluminium is leached into the waters.. While much of the aluminium present in surface waters is organically-bound and relatively non-toxic, certain inorganic species are highly toxic. The best indicator of recovery from the acidification of lakes and streams would be a decrease in the concentrations of inorganic monomeric aluminium, the most toxic form. Decreases in total aluminium would also suggest recovery, although the actual magnitude of the improvement in chemical conditions for biota would be unknown because such decreases would not disclose how much of the total aluminium decrease is due to inorganic versus organic forms of aluminium having been decreased.
Biological effects of acid rain
Effects on aquatic organisms
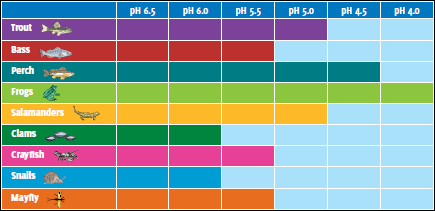
The pH tolerance of various aquatic species. The light blue areas indicate the pH levels which cannot be tolerated by the various species.[11]
The biological effects of acidification have been demonstrated in laboratory whole-ecosystem acidification experiments and in field surveys. A number of species, especially of fish and macro-invertebrates, that commonly occur in surface waters cannot survive, reproduce, or compete in acidic waters. Sensitive species may be lost even at moderate levels of acidity, which leach aluminium from soil, a metal that can be highly toxic to fish at extremely low concentrations.
As shown in the adjacent diagram depicting the pH tolerance of various aquatic life species, frogs have a high tolerance to increasing acidity (lower pH) and snail have a low tolerance to increasing acidity. Decreases in pH and elevated concentrations of aluminium have reduced the species diversity and abundance of aquatic life in many streams and lakes of the northeastern United States. Fish have received most of the attention to date, but entire food chains are often adversely affected. In the Adirondacks, a significant positive relationship exists between the pH of lakes and the number of fish species present in those lakes. Surveys of 1,469 Adirondack lakes conducted in 1984 and 1987 show that 24 percent of lakes in this region do not support fish. These lakes had consistently lower pH and higher concentrations of aluminium than lakes that contained one or more species of fish. Even acid-tolerant fish species such as brook trout have been eliminated from some waters in the northeastern United States.
The absence of fish and the presence of aluminium in lakes provide important information about the condition of soils within a watershed. The release of aluminium from the soil into rivers and streams usually indicates that the available calcium in the soil is low and has been depleted. Furthermore, trees growing in such soils may experience greater nutritional stress.
Effect on soils
Acid deposition has altered and continues to alter soils in parts of the northeastern United States in three ways. Acid deposition depletes calcium and other base cations from the soil; facilitates the leaching of inorganic aluminium into soil water; and increases the accumulation of sulphur and nitrogen in the soil.
Loss of calcium and other base cations: In the past 50-60 years, acid deposition accelerated the loss of large amounts of available calcium from soils in the northeastern United States. The depletion of calcium has been documented at more than a dozen study sites throughout the northeast, including sites in the Adirondacks, the White Mountains, the Green Mountains, and the state of Maine. Depletion occurs when base cations are displaced from the soil by acid deposition at a rate faster than they can be replenished by the slow breakdown of rocks or the deposition of base cations from the atmosphere. This depletion of base cations fundamentally alters soil processes, compromises the nutrition of some trees, and hinders the capacity for sensitive soils to recover.
Leaching of inorganic aluminium: Aluminium is often released from soil to soil water, vegetation, lakes, and streams in forested regions with high acid deposition, low amounts of available calcium, and high soil acidity. Aluminium can be toxic to plants, fish, and other organisms. Concentrations of aluminium in streams in areas affected by acid rain are often above levels considered toxic to fish and much greater than concentrations observed in forested watersheds receiving low levels of acid deposition.
Accumulation of sulfur and nitrogen: The deposition of sulfuric and nitric acids results in the formation and accumulation of sulfur (in the form of sulfate) as well nitrogen in forest soils. As the sulfate is released from the soil, it acidifies nearby streams and lakes. The recovery of surface waters in response to regulatory acid gas emission controls has therefore been delayed and will not be complete until the sulfate caused by acid deposition is released from the soil.
Similarly, nitrogen has accumulated in soil beyond the amount needed by the forest and appears now to be leaching into surface waters in many parts of the northeastern United States. This process also acidifies lakes and streams. Forests typically require more nitrogen for growth than is available in the soil. However, several recent studies suggest that in some areas, nitrogen levels are above what forests can use and retain.
Effects on forest ecosystems
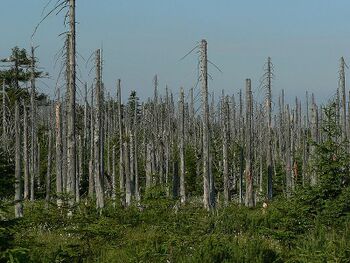
The 1990 National Acid Precipitation Assessment Program (NAPAP) report to Congress[12] to Congress concluded there was insubstantial evidence that acid deposition had caused the decline of trees other than red spruce growing at high elevations. More recent research shows that acid deposition has contributed to the decline of red spruce trees throughout the eastern United States and sugar maple trees in central and western Pennsylvania. Symptoms of tree decline include poor crown condition, reduced tree growth, and unusually high levels of tree mortality. Red spruce and sugar maple are the species that have been most intensively studied.
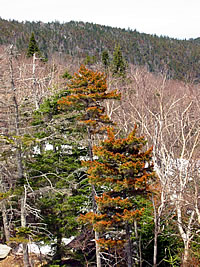
Red Spruce trees: Since the 1960s, more than half of large canopy red spruce in the Adirondack Mountains of New York and the Green Mountains of Vermont and approximately one quarter of large canopy red spruce in the White Mountains of New Hampshire have died. Significant growth declines and winter injury to red spruce have been observed throughout its range. Acid deposition is the major cause of red spruce decline at high elevations in the northeastern United States. Red spruce decline occurs by both direct and indirect effects of acid deposition. Direct effects include the leaching of calcium from a tree’s leaves and needles , whereas indirect effects refer to changes in the underlying soil chemistry.
Recent research suggests that the decline of red spruce is linked to the leaching of calcium from cell membranes in spruce needles by acid rain. The loss of calcium renders the needles more susceptible to freezing damage, thereby reducing a tree’s tolerance to low temperatures and increasing the occurrence of winter injury and subsequent tree damage or death. In addition, elevated aluminium concentrations in the soil may limit the ability of red spruce to take up water and nutrients through its roots. Water and nutrient deficiencies can lower a tree’s tolerance to other environmental stresses and cause decline.
Sugar Maple trees: The decline of sugar maple has been studied in the eastern United States since the 1950s. Extensive mortality among sugar maples in Pennsylvania appears to have resulted from deficiencies of base cations, coupled with other stresses such as insect defoliation or drought. According to research studies, the probability of the loss of sugar maple crown vigor or the incidence of tree death increased on sites where supplies of calcium and magnesium in the soil and foliage were the lowest and stress from insect defoliation and/or drought was high. In northwestern and north central Pennsylvania, soils on the upper slopes of unglaciated sites contain low calcium and magnesium supplies as a result of the leaching of these elements by acid deposition combined with more than half a million years of weathering. Low levels of these base cations can cause a nutrient imbalance and reduce a tree’s ability to respond to stresses such as insect infestation and drought.
Trends in acidification
In the United States, governmental regulatory controls of the emissions of sulfur dioxide and nitrogen oxides, initiated in the 1970s and 1990s, have resulted in significantly reducing the acidification of soils, lakes and streams. Especially important is the "Acid Rain Program" in the United States' Clean Air Act which has the goals of:
- lowering the annual emissions of sulfur dioxide to half of 1980 levels, capping them at 8.95 million tons starting in 2010 and
- lowering the annual emissions of nitrogen oxides to 2 million tons lower than the forecasted level for 2000, reducing annual emissions to a level of 6.1 million tons in 2000.
Over the past few decades:
- Ambient sulfur dioxide and sulfate levels are down more than 40 percent and 30 percent, respectively, in the eastern United States.
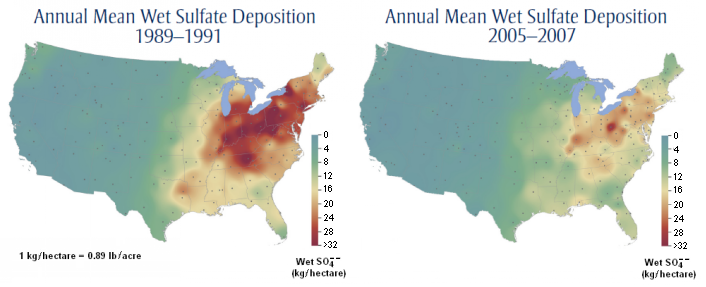
- Wet sulfate deposition has decreased about 40 percent in the northeastern United States and about 15 − 20 percent in the southeastern United States (see the two maps below).
- Some modest reductions in inorganic nitrogen deposition and wet nitrate concentrations have occurred in the Northeast and Mid-Atlantic regions of the United States, but other areas have not shown much improvement.
These trends indicate significant progress, but acid rain remains a significant long-term issue in the United States and elsewhere. Importantly, the emission and atmospheric deposition of base cations that help counteract acid deposition have declined significantly since the early 1960s with the enactment of air pollution controls on particulate matter, and the ability of ecosystems to neutralize acid deposition has decreased in some regions. Consequently, lakes, streams, and soils in many parts of the northeast are still acidic and exhibit signs of degradation linked to acid deposition.
Ecosystem recovery from acid deposition
Recovery from acid deposition requires decreases in acid gas emission which to reductions in acid deposition and allow chemical recovery. Chemical recovery is characterized by decreased concentrations of sulfate, nitrate, and aluminium in soils and surface waters. If sufficient, these reductions will eventually lead to increased pH and acid-neutralizing capacity (ANC), as well as higher concentrations of base cations. As chemical conditions improve, the potential for the second phase of ecosystem recovery, biological recovery, is greatly enhanced.
Biological recovery is likely to occur in stages, since not all organisms can recover at the same rate and may vary in their sensitivity to acid deposition. The current understanding of species’ responses to improvements in chemical conditions is incomplete, but research suggests that stream macro-invertebrates may recover relatively rapidly (i.e., within 3 years), while lake zooplankton may need a decade or more to fully re-establish. Fish populations in streams and lakes should recover in 5-10 years following the recovery of the macro-invertebrates and zooplankton which serve as food sources. It is possible that, with improved chemical conditions and the return of other members of the aquatic food chain, the stocking of streams and lakes could help to accelerate the recovery of fish.
Recovery of the forests and soils that have been acidified is more difficult to project than aquatic recovery. Given the life span of trees and the delay in the response of soil to decreases in acid deposition, it is reasonable to suggest that decades will be required for affected trees on sensitive sites to recover once chemical conditions in the soil are restored.
The time required for chemical recovery varies widely among ecosystems in the northeastern United States, and is primarily a function of:
- the historic rate of sulfur and nitrogen deposition
- the rate and magnitude of decreases in acid deposition
- the extent to which base cations such as calcium have been depleted from the soil
- the extent to which sulfur and nitrogen have accumulated in the soil and the rate at which they are released as deposition declines
- the weathering rate of the soil and underlying rock and the associated supply of base cations to the ecosystem
- the rate of atmospheric deposition of base cations
Affected areas
Acid rain symptoms have been reported in many locations worldwide:
Europe
During the latter half of the 20th century, pH values in the groundwater of Northern and Central Europe fell. The effect was especially pronounced in Southwestern Sweden, Southern Norway and parts of Germany.[13]
Asia
Acidic rain is an important issue in China and Japan. Given the area's generally increasing energy usage, the annual SO2 emissions in Asia could reach 110 million metric tonnes if action to reduce emission is not taken. Especially the escalating coal power production, mainly in China, is a major concern.[14]
References
- ↑ Acid rain, explained by Christina Nunez on NationalGeographic.com, February 28, 2019. The fossil fuels that humans burn for energy can come back to haunt us as acid rain.
- ↑ Note: Sulfuric acid is formed from the sulfur dioxide resulting from combustion of sulfur-containing fuels. Nitric acid is formed from nitrogen oxides resulting from the high-temperature partial conversion of the nitrogen contained in the combustion air.
- ↑ Jump up to: 3.0 3.1 3.2 The primary source for this article was Acid Rain August 7, 2010 (last revised October 19, 2010), Gene Likens (Lead author), Wayne Davis, Lori Zaikowski and Stephen C. Nodvin. (Published on the website of the Encyclopedia of Earth)
- ↑ Note: Site of the Hubbard Brook Ecosystem Study in the White Mountains of New Hampshire
- ↑ Acid rain From the website of the U.S. Environmental Protection Agency
- ↑ National Atmospheric Deposition Program 2006 Annual Summary
- ↑ Acid Deposition Bulletin American Meteorological Society, 85, 299—301, adopted by the American Meteorological Society, September 2003
- ↑ Note: The acid-neutralizing capacity (ANC) of a lake or stream is analogous to the alkalinity of the lake or stream
- ↑ Effects of Acid Rain - Surface Waters and Aquatic Animals The NSWS included an Eastern Lake Survey (published in 1986), a Western Lake Survey (published in 1987) and a National Stream Survey (published in 1988). The various reports published by the NSWS are available from the U.S. Environmental Protection Agency.
- ↑ Frequently Asked questions What is acid rain? ... and other acid rain questions, Maine Department of Environmental Protection, Bureau of Air Quality.
- ↑ Learning About Acid Rain From the website of the U.S. EPA
- ↑ National Acid Precipitation Assessment Program Report to Congress, 2005
- ↑ Nationalencyclopedin (The National Encyclopedia of Sweden), "Försurning", 2010, link (subscription required)
- ↑ World Resources 1998-99, World Resources Staff, 1998.
- Editable Main Articles with Citable Versions
- CZ Live
- Biology Workgroup
- Chemistry Workgroup
- Chemical Engineering Subgroup
- Environmental Engineering Subgroup
- Articles written in American English
- Advanced Articles written in American English
- All Content
- Biology Content
- Chemistry Content
- Chemical Engineering tag
- Environmental Engineering tag
- Reviewed Passed
