Venn diagram
A Venn diagram is a graphical representation of common relationships shared by different sets made from arrangements of intersecting closed curves in a plane (or possibly its generalization to higher dimensional surfaces). The Venn diagram may be viewed on its own as a subject of geometry (the geometry of intersecting shapes subject to certain aesthetic rules) or as a tool used to present logical concepts and propositions. "Mapping graphically the relationships of objects or people with something in common can produce beautiful and intricate patterns. It can also help engineers design computer chips."[1]
History
The use of Venn diagrams was introduced by John Venn (1834-1923).[2] A brief biography is found in Hurley.[3] A great many new Venn diagrams were found by Edwards using a different methodology.[4]
Examples using two sets
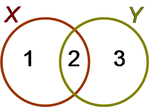
Suppose X and Y are sets, for example, collections of some description. Various operations allow us to build new sets from them, and these definitions are illustrated using the Venn diagram in the figure.[5] The use of circles is conventional, but rectangles or other closed shapes serve the same purpose.
Union
The union of X and Y, written X∪Y, contains all the elements in X and all those in Y. It consists of all three numbered regions ‘1’,‘2’, and ‘3’. For example, X may be "drownings" and Y may be "boating accidents". Then X∪Y represents "water-related accidents", assuming no other categories.
Intersection
The intersection of X and Y, written X∩Y, contains all the elements that are common to both X and Y. It consists of only the numbered region ‘2’. For example, X may be "drownings" and Y may be "boating accidents". Then X∩Y represents "drownings involving boating accidents".
Difference
The difference X minus Y, written X−Y or X\Y, contains all those elements in X that are not also in Y. It consists of the numbered region ‘1’. Likewise, Y−X consists of the region numbered ‘3’. For example, X may be "drownings" and Y may be "boating accidents". Then X−Y represents "drownings not involving boating accidents".
Complement and universal set
The universal set (if it exists), usually denoted U, is a set of which everything under discussion is a member. In pure set theory, normally sets are the only objects considered. In that case, U would be the set of all sets. However, one may also consider sets that are collections of numbers, or colors, or books, for example; see Set (mathematics).
In the presence of a universal set we can define X′, the complement of X, to be U−X. Set X′ contains everything in the universe apart from the elements of X.
Multiple sets
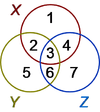
The various possible subsets of three sets X, Y and Z are shown in the left-hand figure as numbered spaces. For example, the area labeled ‘1’ is the subset of all points that are in X but in neither Y nor Z. The subset labeled ‘3’ is the set of all points common to all of X, Y and Z. Every conceivable arrangement of inclusion and exclusion from any combination of X, Y and Z can be assembled from the numbered subsets in the diagram.
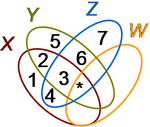
The use of circles cannot be extended to more than three sets, however, because insufficient regions can be created to house all the possibilities for subsets. For four sets, ellipses can be used as shown in the figure at right. The numbers correspond to the figure for three sets, but the extra subsets related to set W have not been numbered. For example, as before, the subset labeled ‘3’ is the set of all points common to all of X, Y and Z, but not in W. The asterisk ‘*’ labels the subset of all points common to all four sets X, Y, Z, and W.
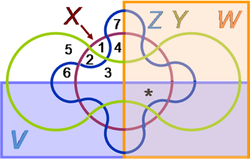
As the number of sets increases, the Venn diagrams become more complicated and harder to follow. An example is shown for five sets as devised by Edwards by mapping first onto a sphere and then projecting the results on a plane.[4] The numbered regions correspond to the cases in the figure for three sets, and are all in the upper left quadrant. The symmetry of the diagram shows that the lower left quadrant repeats these cases but with set V included, the upper right quadrant does the same for set W and the lower right quadrant includes both V and W. The asterisk locates the region common to all five sets.
As the number of sets increases, the curves become more convoluted, and a simple visualization becomes difficult, or perhaps impossible, to achieve.
References
- ↑ Anthony Edwards (Jan. 7, 1989). "Venn diagrams". The New Scientist 121 (1646): pp. 51 ff.
- ↑ John Venn (1883). "On the employment of geometrical diagrams for the sensible representation of logical propositions". Proceedings of the Cambridge Philosophical Society: Mathematical and physical sciences 4: pp. 47 ff. and also John Venn (1881). “Chapter V: Diagrammatic representation”, Symbolic logic. Macmillan, pp. 100 ff. Symbolic Logic available also from Chelsea Pub. Co. ISBN 0828402515 (1979) and from the American Mathematical Society ISBN 0821841998 (2006).
- ↑ Patrick J. Hurley (2007). “Eminent logicians: John Venn”, A concise introduction to logic, 10th ed. Cengage learning, p. 252. ISBN 0495503835.
- ↑ 4.0 4.1 Anthony William Fairbank Edwards (2004). “Figure 3.6: Edwards-Venn diagrams for three to eight sets”, Cogwheels of the mind: the story of Venn diagrams. JHU Press, pp. 36 ff. ISBN 0801874343.
- ↑ Alan Garnham, Jane Oakhill (1994). “§6.2.3b: Venn diagrams”, Thinking and reasoning. Wiley-Blackwell, pp. 105 ff. ISBN 0631170030.
Note: CZ:List-defined references methodology is used for references here.


