Venn diagram
A Venn diagram is a visualization of logical concepts and propositions using arrangements of intersecting closed curves in a plane.
History
The use of Venn diagrams was introduced by John Venn (1834-1923).[1] A brief biography is found in Hurley.[2]
Examples using two sets
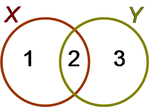
Suppose X and Y are sets, for example, collections of some description. Various operations allow us to build new sets from them, and these definitions are illustrated using the Venn diagram in the figure.[3]
Union
The union of X and Y, written X∪Y, contains all the elements in X and all those in Y. It consists of all three numbered regions ‘1’,‘2’, and ‘3’.
Intersection
The intersection of X and Y, written X∩Y, contains all the elements that are common to both X and Y. It consists of only the numbered region ‘2’.
Difference
The difference X minus Y, written X−Y or X\Y, contains all those elements in X that are not also in Y. It consists of the numbered region ‘1’. Likewise, Y−X consists of the region numbered ‘3’.
Complement and universal set
The universal set (if it exists), usually denoted U, is a set of which everything under discussion is a member. In pure set theory, normally sets are the only objects considered. In that case, U would be the set of all sets. However, one may also consider sets that are collections of numbers, or colors, or books, for example; see Set (mathematics).
In the presence of a universal set we can define X′, the complement of X, to be U−X. Set X′ contains everything in the universe apart from the elements of X.
Multiple sets
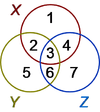
The various possible subsets of three sets X, Y and Z are shown in the left-hand figure as numbered spaces. For example, the area labeled ‘1’ is the subset of all points that are in X but in neither Y nor Z. The subset labeled ‘3’ is the set of all points common to all of X, Y and Z. Every conceivable arrangement of inclusion and exclusion from any combination of X, Y and Z can be assembled from the numbered subsets in the diagram.
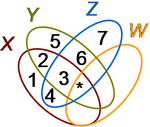
The use of circles cannot be extended to more than three sets, however, because insufficient regions can be created to house all the possibilities for subsets. For four sets, ellipses can be used as shown in the figure at right. The numbers correspond to the figure for three sets, but the extra subsets related to set W have not been numbered. For example, as before, the subset labeled ‘3’ is the set of all points common to all of X, Y and Z, but not in W. The asterisk ‘*’ labels the subset of all points common to all four sets X, Y, Z, and W.
As the number of sets increases, the Venn diagrams become complicated and hard to follow, the curves become more distorted, and a simple visualization becomes difficult, or perhaps impossible, to achieve.
References
- ↑ John Venn (1883). "On the employment of geometrical diagrams for the sensible representation of logical propositions". Proceedings of the Cambridge Philosophical Society: Mathematical and physical sciences 4: pp. 47 ff. and also John Venn (1881). “Chapter V: Diagrammatic representation”, Symbolic logic. Macmillan, pp. 100 ff. Symbolic Logic available also from Chelsea Pub. Co. ISBN 0828402515 (1979) and from the American Mathematical Society ISBN 0821841998 (2006).
- ↑ Patrick J. Hurley (2007). “Eminent logicians: John Venn”, A concise introduction to logic, 10th ed. Cengage learning, p. 252. ISBN 0495503835.
- ↑ Alan Garnham, Jane Oakhill (1994). “§6.2.3b: Venn diagrams”, Thinking and reasoning. Wiley-Blackwell, pp. 105 ff. ISBN 0631170030.
Note: CZ:List-defined references methodology is used for references here.


