Process flow diagram
A process flow diagram (PFD) is a diagram commonly used by chemical engineers in the process design of petroleum refineries, natural gas processing plants, petrochemical and chemical plants and other industrial facilities to indicate the general flow of plant process streams and equipment.[1][2][3]
The PFD displays the relationship between major equipment of a plant facility and does not show details such as minor equipment items, piping materials of construction and piping sizes. Another commonly-used term for a PFD is a process flowsheet.
Typical content of a process flow diagram
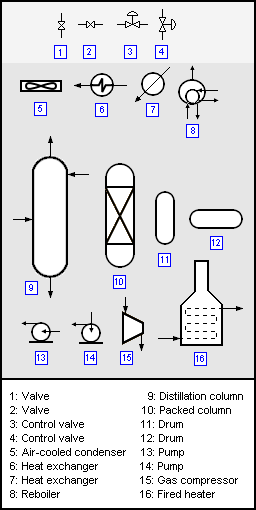
Examples of typical PFD symbols. A great many more typical PFD symbols are available online.[4]
Typically, process flow diagrams of a single unit process will include the following:[4]
- Process piping
- Major bypass and recirculation lines
- Major equipment symbols, names and identification (either by name, number or both)
- Flow directions (indicated by arrows on the process streams)
- Pressure, temperature, flow rate and other control valves and systems that monitor and control the operation of the process (shown schematically, rather than in complete detail)
- Interconnecting lines with other systems (if any)
- Pressure, temperature, flow rate and other pertinent operational values for each of the equipment items such as pumps, gas compressors, distillation columns and other vessels
- In some cases, the process flow diagram includes a material balance that lists the normal temperature, pressure, amount and composition of all the major process streams. Also included in some cases, are the amount of heat provided by any process furnaces and the amount of heat exchanged by any process heat exchangers.
Process flow diagrams generally do not include:
- Pipe classes or piping line numbers
- Pipe sizes
- Process control instrumentation (sensors and final elements) in detail
- Minor bypass lines
- Isolation and shutoff valves
- Maintenance vents and drains
- Relief and safety valves
- Flanges (if any)
The adjacent image provides some examples of the typical symbols used in PFDs to represent various major equipment items, piping and valves. It is by no means completely inclusive, but it is representative of the great many such symbols commonly used in drawing PFDs.
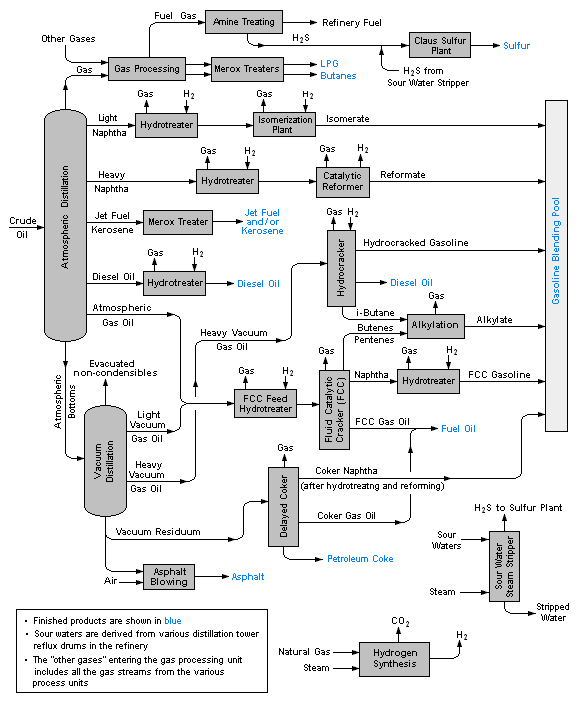
Process flow diagrams of multiple process units within a large industrial plant will usually contain less detail and may be called block flow diagrams or schematic flow diagrams.
Process flow diagram examples
Single process unit
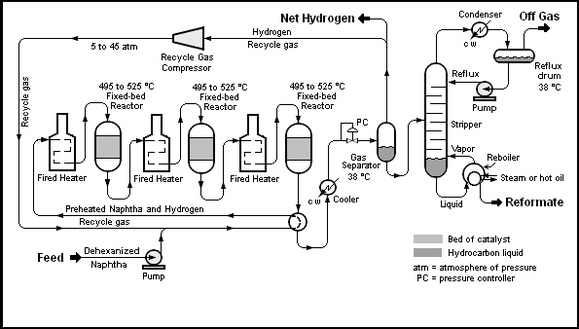
The process flow diagram below depicts a single chemical engineering unit process known as a catalytic reforming unit which is widely used in most, if not all, petroleum refineries. It does not include all of the above listed process flow diagram components to avoid disclosure of proprietary information and, although not usually done in practice, some color has been added.
Multiple process units within an industrial plant
The process flow diagram below is an example of a schematic or block flow diagram and depicts the various unit processes within a typical oil refinery:
Simple block flow diagrams
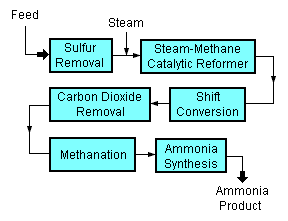
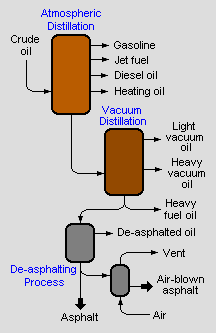
Below are two examples of very simple process block flow diagrams. One is a diagram of the processes used to produce ammonia and the other is a diagram of a process for producing petroleum asphalt:
Other items of interest
A PFD can be computer generated from process simulators, CAD packages, or flow chart software using a library of chemical engineering symbols. Rules and symbols are also available from standardization organizations such as:
- ISO 10628: Flow Diagrams For Process Plants - General Rules[5]
- ANSI Y32.11: Graphical Symbols For Process Flow Diagrams (out of print but in stock as of June 2009)[5]
Many large industrial companies in the process industries, and the engineering companies that serve them, have their own extensive proprietary sets of PFD symbols.
PFDs of many commercial processes can be found in the literature, although some might be outdated. To find recent ones, patent databases such as those available from the United States Patent and Trademark Office can be useful.
References
- ↑ Martyn S. Ray and Martin G. Sneesby (1998). Chemical Engineering Design Project: A Case Study Approach, 2nd Edition. Gordan and Breach Science Publishers. ISBN 90-5699-136-1.
- ↑ Richard Turton, Richard C. Bailie, Wallace B. Whiting and Joseph A. Shaeiwitz (2002). Analysis, Synthesis, and Design of Chemical Processes, 2nd Edition. Prentice Hall. ISBN 0-13-064792-6.
- ↑ James R. Couper, W. Roy Penny, James R. Fair and Stan Walas (2005). Chemical Process Equipment: Selection and Design, 2nd Edition. Gulf Professional Publishing. ISBN 0-7506-7510-1.
- ↑ 4.0 4.1 Charles E. Thomas (2007). Process Technology Equipment and Systems, 2nd Edition. Delmar Cengage Learning. ISBN 1-4180-3067-8. Chapter 12 includes comprehensive, detailed displays of all the typical symbols for the process flow diagrams used in the petroleum, natural gas, chemical and petrochemical industries. A copy of Chapter 12 is available here online.
- ↑ 5.0 5.1 IHS Standards Store
