Tetration
Tetration is a rapidly growing mathematical function, which was introduced in the 20th century and proposed for the representation of huge numbers in the mathematics of computation. For positive integer values of its argument , tetration on base can be defined with:
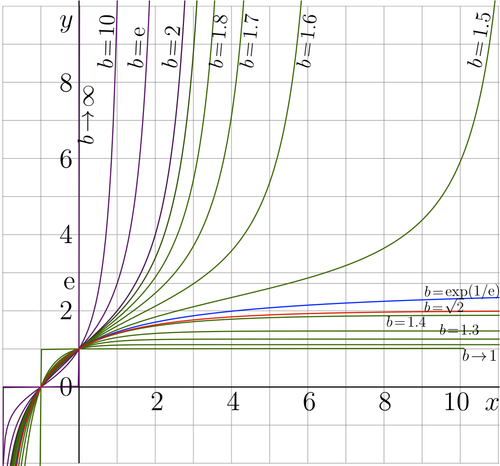
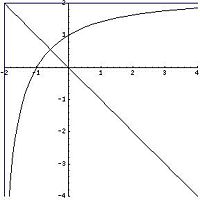
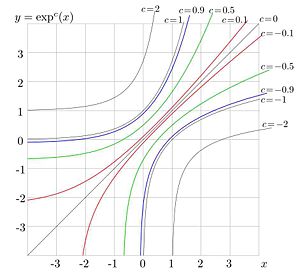
For real values of the argument and various values of the base , this is plotted in Fig.0.
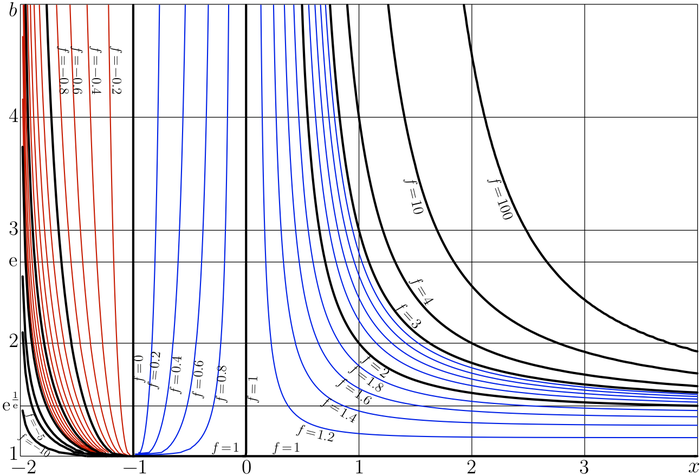
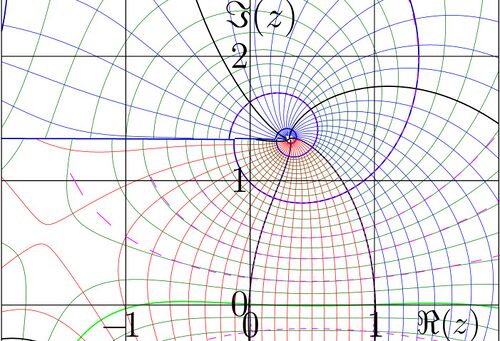
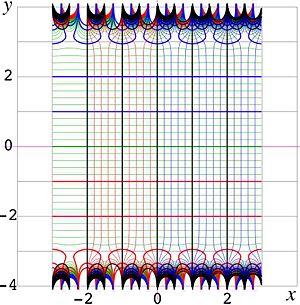
The map of in the plane is shown in Fig.1 with levels .
Up to year 2011, this function has not been listed among elementary functions, it is not implemented in programming languages and it is not used for the internal representation of data in computers.
In this article, the generalizaiton of tetration for complex (and, in particular, real) values of its argument is described. At base , tetration is assumed to be a holomorphic function, at least for positive values of the real part of its argument. This tetration is used to construct the holomorphic extension of the iterated exponential for the case of non-integer values of the number of iterations.
Definition
For real , Tetration on the base is a function of a complex variable, which is holomorphic at least in the range , bounded in the range , and satisfies conditions
at least within the range .
According to this definition, tetration is superfunction of the exponential. This justifies the alternative name "superexponential" for this function and "superlogarithm" for the inverse function. The definition above generalizes the definitions, recently suggested for the specific cases of base [1] and [2].
Etymology and place of tetration in the big picture of math
Creation of word tetration is attributed to the English mathematician Reuben Louis Goodstein [3].
The place of tetration in the mathematical analysis can be seen at the strong zoom-out of the big picture of math. Using mathematical notation, the zoom-out of the mathematical analysis can be drawn as follows:
- has only one argument and means unitary increment
- ;
- ;
- ;
- ;
- ;
Except the zeroth row, each operation in the sequence above is just a recurrence of operations from the previous row. Operation ++ could be called zeration (although in programming languages it is called increment), addition (or summation) could be called unation, multiplication (or product) could be called duation , exponentiation coluld be called trination. The following operations ( tetration, pentation) have not been used so often, at least up to the year 2008. Although tetration has been given many other names: superexponentiation [4], ultraexponent [5], generalized exponent [6], other names were not applied to the holomorphic extension of tetration, defined in the previous section.
Manipulation with the holomorphic extensions and the inverses of summation, multiplication, exponentiation form the core of the mathematical analysis. The table above shows the place of tetration in the big picture of math, in the penultimate row.
In the scheme above, each next operation appears as a superfunction with respect to the previous one. In such a way, the name tetration indicates, that this operation is fourth (id est, tetra) in the hierarchy of operations after summation, multiplication, and exponentiation. In principle, one can define "pentation", "sextation", "septation" in a similar manner, although tetration, perhaps, already has a growth rate fast enough for the requirements of the 21st century.
Real values of the arguments, general view
Examples of behavior of this function at the real axis are shown in figure 1 for values , , , and for . It has a logarithmic singularity at , and it is a monotonic increasing function.
At tetration approaches its limiting value as , and .
Fast growth and application
For tetration grows faster than any exponential function. For this reason tetration has been proposed for the representation of huge numbers in the mathematics of computation[4]. A number that cannot be stored as floating point could be represented as for some standard value of (for example, or ) and relatively moderate value of . The analytic properties of tetration could be used for the implementation of arithmetic operations with huge numbers without to convert them to the floating point representation.
Integer values of the argument
For integer , tetration can be interpreted as iterated exponential:
and so on; then, the argument of tetration can be interpreted as number of exponentiations of unity. From definition it follows, that
and
Relation with the Ackermann function
At base , tetration is related to the Ackermann function [7]
where the Ackermann function is defined, for non-negative integer values of its arguments, by the following equations
The generalization of the 4th Ackermann funciton for the complex values of is described in the preprint [2] . Construction of such holomorphic extension is equivalent to construction of tetration for the base .
Asymptotic behavior and properties of tetration
The analytic extension of tetration grows rapidly along the real axis of the complex -plane, at least for some values of base . However, it does not grow infinitely in the direction of imaginary axis. The asymptotic behavior determines the basic properties of tetration.
The exponential convergence of discrete iteration of logarithm corresponds to the exponential asymptotic behavior
where
- ,
and are fixed complex numbers, and is eigenvalue of logarithm, solution of equation
- .
Solutions of this equation are called fixed points of logarithm.
Fixed points of logarithm
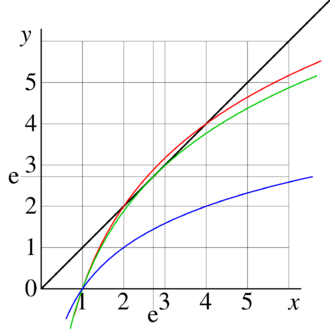
Three examples of graphical solution of equation for fixed points of logarithm are shown in figure 2 for , , and .
The black line shows function in the plane. The colored curves show function for cases (red), (green), and (blue).
At , there exist 2 solutions, and .
At there exists one solution .
and , there are no real solutions.
In general,
- at , there are two real solutions;
- at , there is one solution, and
- at , there exist two solutions, but they are complex.
In particular,
at
, the solutions are
and
.
At
, the solutions are
and
.
At , the solutions are
and
.
A few hundred straightforward iterations of equation are sufficient to get the error smaller than the last decimal digit in the approximations above.
Basic properties
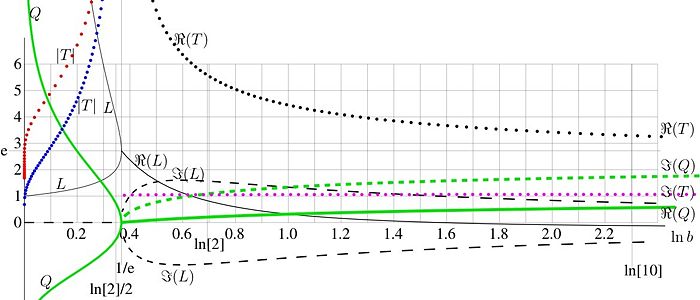
The solutions and of equation (14) are plotted in figure 3 versus with thin black lines. At , both and are real and positive. Let , and only at , the equality takes place. Basic properties of tetration are determined by the base . The main parameters versus are plotted in figure 3. The thin black solid curve at represents the real part of the solutions and of (14); the thin black dashed curve represents the two options for the imaginary part; the two solutions are complex conjugaitons of each other. Requirement of definition of tetration determine the asymptotic of the solution. Parameter determines periodicity of quasi-periodicity of tetration. The two solutions for are shown in figure 3 with green lines.
At both solutons for are real. The negative corresponds to tetration, decaying to the asymptotic value in the direction of real axis; positive corresponds to the solution growing along the real axis. At the real axis, such a solution remains larger than unity; this does not allow to satisfy confition . Therefore, only one negative corresponds to the asymptotic behavior of tetration.
At , both options for are mutually complex conjugate. The real part is shown thif thick green line; one option of the imaginary part is shown with dashed line.
Possibilities for the period (or quasi-period) are shown in Figure 3 with fotted lines. At , only "negative" period corresponds to tetration. At , the periodicity can be achieved only asymptotically; and is quasi-period. The real part of quasi-period is markes with black dotted line; one of two options tor the imaginary part is marked with pink dotted line.
Generally, at , tetration is periodic; the period is pure imaginary.
At , tetration is not periodic, and no exponential asymptotic exist.
, tetration is quasi–periodic, the quasi-period in the upper complex half-plane is conjugate to that in the lower complex half-plane. The larger is base , the shorter is quasi-period. As the quasi-periods are complex conjugated, the quasi-periodicity takes place away from the real axis.
Evaluation of tetration
As the asymptotics of tetration are critically dependent on the base in the vicinity of the value , the evaluation procedure is different for the cases , , and , and these should be considered separately.
Case
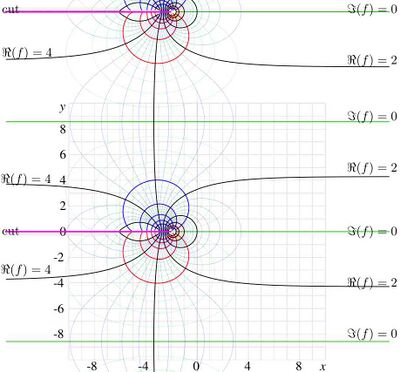
For , the period is imaginary. The period with smallest modulus corresponds to the solution that is unity at the origin of coordinates. For , the function is shown in figure 4 with levels of constant real part and levels of constant imaginary part. Levels and levels aew shown with thick lines. Intermediate levels are shown with thin lines. There are branch points at ; the cut lines are . For this value of the base, the period
- Failed to parse (syntax error): {\displaystyle T=\frac{2\pi}{\ln^2(2)}\approx −17.1431481793548471041794 ~\mathrm{i}} .
There is a cut at , ; although the jump at this cut reduces at the increase of . In such a way, the function approaches its limiting value almost everywhere, although there is set of singularities at negative integer values of .
The solution follows asymptotic at large values of real part of the argument, exponentially approaching the limiting value. In particular, for , this maximum limiting value is in the left hand side of the figure, and to its minimum llimiting value in the right hand side. For , these limiting values are and .
The trace of the solution along the real axis corresponds to the red dotted curve in Figure 1. Other solutions of the recursive equation , that may grow up along the real axis, can be constructed in a similar way, but they do not satisfy the criteria formulated in the definition of tetration; in particular, .
Case
At , the limiting value , and, asymptotically,
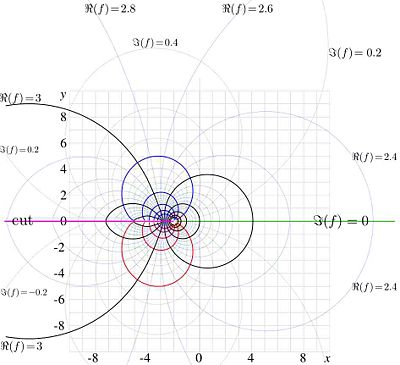
The function is shown in figure 5.
Levels are shown with thick black lines.
Levels are shown with thick red lines.
Levels are shown with thick blue lines.
Intermediate levels are shown with thin lines.
There is a cut at , , but the hump of the function at the cut reduces as reduces, id est, with increasing . In such a way, everywhere, at , the function approaches its limiting value . almost everywhere, although there is a set of singularities at negative integer values of .
Behavior of this function at real values of argument is shown in Figure 1 with thin solid line. Other solutions of the recursive equation can be constructed in the similar way; they may grow up along the real axis, but they do not satisfy criteria formulated in the definition of tetration; in particular, .
Case
At , tetration is asymptotically periodic. It decays exponentially to the fixed points and in the upper and lower halfplane. This allows to express it through its values along the imaginary axis, using the Cauchi integral. [1].
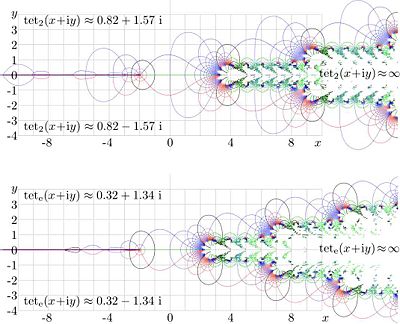
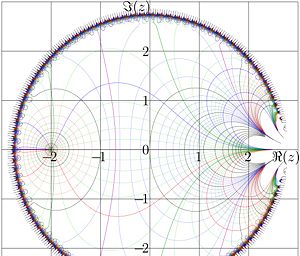
For the base and tetration is plotted in figure 6. Levels and are drawn with thick lines. The function has a logarithmic singularity at point -2 and cut at real values of the argument, smaller than -2. In the right hand side, symbols mean huge values that cannot be stored in the conventional floating point representation (logarithm, mantissa). In the upper left and lower left part of eath graphic, the function approaches its asymptotic values and . Function is quasi-periodic; the same fractal structure reproduces again and again at the translation of argument with quasiperiod in the upper halfplane and in the lower halfplane.
There is cut at , . The jump of the function at this cut approaches almost everywhere, although there is set of singularities at negiative integer values of .
Along the real axis, tetration for these values of the base is plotted also in figure 1 with thick solid and dashed lines.
Behavior along the real axis
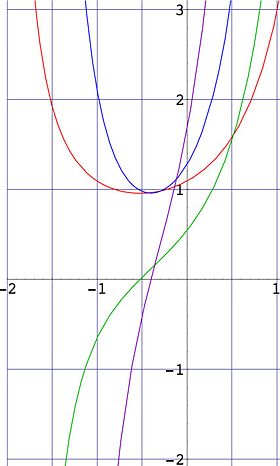
The growth of tetration along the real axis is crucially determined by its base. The graphic of this function is shown at the top of the article for . For , the derivatives of tetration are plotted in figure at the right.
- is plotted with red;
- is plotted with green;
- is plotted with blue;
- is plotted with pink.
Tetration is strictly growing function; its first derivative is positive. For the minimum of the derivative takes place in vicinity of and is slightly smaller than unity. At , the growth is limited by the minimum of the limiting values . Tetration approaches this limiting value exponentially. In particular, at , the limiting value is 2.
At , the growth is limited by the fixed point . Tetration approaches this limiting value as rational function.
The growing-up holomorphic solution of equation can be constructed in the similar way also at
, but at the real axis, such a solution remains larger than unity, and the condition cannot be satiscied. Therefore, this solution cannot be interpreted as extension of iterative exponentiation for non-integer number of exponentiations; in this sense, such a solution is not a tetration.
Tetration shows explosively-fast growth along the real axis only at values .
Tetration at the base
There is hypothesis that at , the graphic of tetration is symmetric with respect to the line . This line, together with the graphic, is shown in Figure at let. The asymptotics and are also shown. The graphic looks symmetric with respect to , but no proof of this hypothesis was suggested. Now this hypothesis is negated; the apparent symmetry is only approximation. However, for , at the the segment , the relation holds with 4 decimal digits.
Tetration at base e
Holomorphic tetration on the natural base is the most developed, at least up to the year 2008. In the rest of this article, it is assumed that although the majority of results allow a straightforward extension to the case of real .
Tertation has real fixed point , id est, solution of the equation . Its approximaiton
can be found, iterating equation , where slog is inverse function of tetration.
Expansion of tetration in vicinity of its fixed point can be used for evaluation of holomorphic pentation, id est, solution of equations
Inverse of tetration
The inverse of tetration can be performed using the Newton method, solving equation , leading to
- .
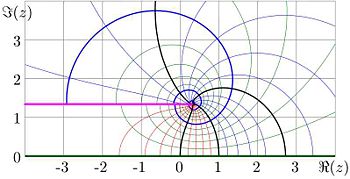
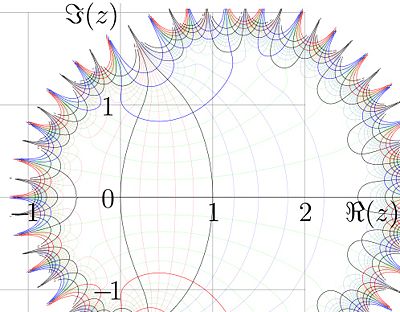
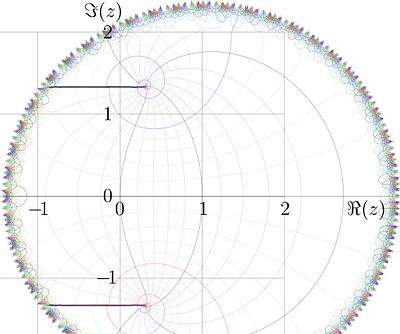
The inverse function has branchpints and . For the kslog, at base , shown in the figure 7, the cuts are placed horisontaly, along the lines
- , .
Due to the symmetry , it is sufficient to plot only half of the complex plane.
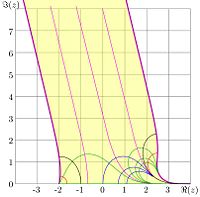
The mapping with function kslog is shown in figure 8. For in the shaded region, the relation
takes place. The upper part of the complex plane is mapped into the upper halfplane, and the lower halfplane is mapped to the lower halfplane. The real axis is mapped into the halfline . The fixed points is mapped to imaginary infinity, following the shaded strip.
In figure 8, the images of the grid lines and images of the grid lines are shown. These curves reproduce levels and shown in figure 6 for .
Together, the pair of functions tet and kslog allow to evaluate any iteration (including negative, fractional and even complex) of the exponential finction.
Beyond the cutlines of slog
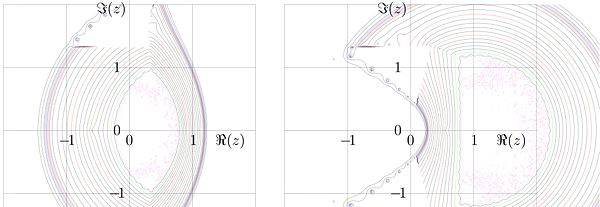
The function slog has branchpoints, and there are many options to pit the cutlines. The cutlines, parallel to the abscias axis, considered above is one of many options. One can put the cutlines along the level . This cases simplify the plotting of the slog function, while the only tetration is available for the efficient evaluation. On the other hand, there is no simple expression for the parametrization of such a cutline, and the calculation of the position of the cutlines slows down the alforithm of evaluation of slog. In addiiton, there is tradition, that cutlines of the special functions are placed parallel to the real or imaginary axis. One could place the cutline from the branchpoints to the abscissa axis. In this case, the additional cutlines should go along the negative part of the real axis, which is not convenient for the applications. (For example, for the evaluation of the generalized exponential at non-integer , it is impoirtant, that the real axis belongs to the range of holomorphism of slog. There are 3 other options to place the cutlines parallel to the coordinate axes, keeping condition . There 3 options are shown in the figure.
The shaded region shows the domain
For evaluation of any ot these superlogarithms, it is sufficient to have the efficioent alforithm for the evlauation in this domain.
The left hand side picture corresponds to the slog, sa it is defined above. Within the strip between the cutlines, the function approaches its limiting value ; it becomes infinite in vicinity of the branch points and varies very slow in the rest of the complex plane.
The centrtal part of the picture represents slog with vertical cutlines, let us call this function slogv. In the left hand side of the complex halfplane, the evaluation of slog begins with exponentiation of its argument. The exponential is periodic function; therefore, in this part, slog is periodic:
The third option, let us denote it slogr, is to put the cutlines in the direction of the real axis. Along the real axis, the function remains holomorphic, but there are additional branchpoints in the ranges . In these regions, the funciton slogr show the fractal behavior.
The slog, defined at the beginning, seems to be simpler than slogv and slogr; therefore, namely slog with howizontal cutlines, parallel to the real axis, goinf in the direction, opposite to the real axis, is used below.
Polynomial approximation
The Taylor series for the tetration can be written in the usual form:
where the th coefficient
is expressed through the derivative of the function. The coefficients of the expansion can be calculated using the straightforward differentiation of the representation through the Cauchy integral.
Taylor expansion at zero
For , the calculation gives the following values
- 0 = 1
- 1 ≈ 1.091767351258322138
- 2 ≈ 0.271483212901696469
- 3 ≈ 0.212453248176258214
- 4 ≈ 0.069540376139988952
- 5 ≈ 0.044291952090474256
- 6 ≈ 0.014736742096390039
- 7 ≈ 0.008668781817225539
- 8 ≈ 0.002796479398385586
- 9 ≈ 0.001610631290584341
- 10≈ 0.000489927231484419
- 11≈ 0.000288181071154065
- 12≈ 0.000080094612538551
- 13≈ 0.000050291141793809
- 14≈ 0.000012183790344901
- 15≈ 0.000008665533667382
- 16≈ 0.000001687782319318
- 17≈ 0.000001493253248573
- 18≈ 0.000000198760764204
- 19≈ 0.000000260867356004
- 20≈ 0.000000014709954143
- 21≈ 0.000000046834497327
- 22≈-0.000000001549241666
- 23≈ 0.000000008741510781
- 24≈-0.000000001125787310
- 25≈ 0.000000001707959267
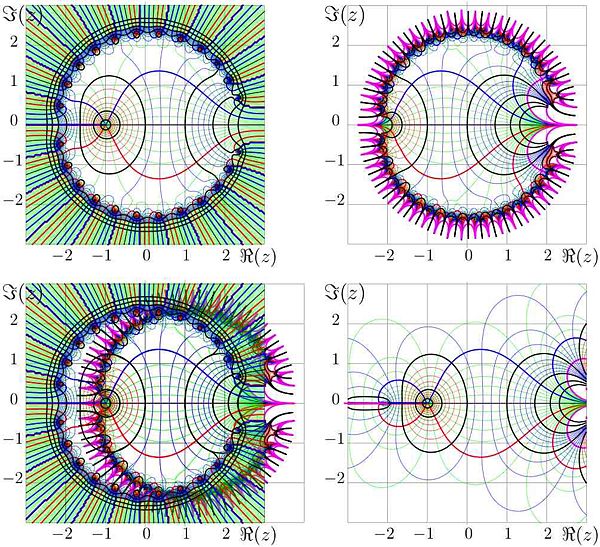
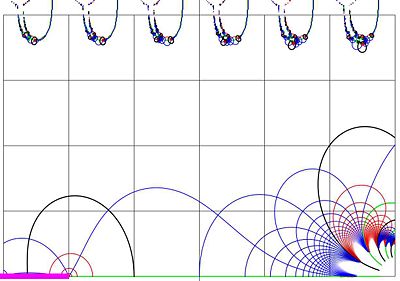
The truncated Taylor series gives the polynomial approximation. In the upper right hand side of the Figure N, the polynomial
is shown in the complex plane.
- Levels are shown with thick black curves.
- Levels are shown with thin red curves.
- Levels are shown with thin thin blue curves.
- Levels are shown with thick red curves.
- Levels are shown with thick blue curves.
- Levels are shown with thick pink curves.
- Levels are shown with thin green curves.
In the upper left corner of figure N, the same is shown for function
At the bottom left, the overlap of the upper two images is shown.
At the bottom right, lines of constant modulus and constant phase of holomorphic tetration in the same range.
The good approximation of tetration takes place in the range of order of unity or smaller; the radius of convergence of the series is 2.
Expansion at 3i
Coefficients of the expansion
can be evaluated in the similar way:
The plot of approximation of tetration with the resulting polynomial of 30th power is shown in figure. This approximation can be used for plotting of camera-ready pictures of tettration, using it and its conjugation at . With 50 terms, at , such approximation returns 14 significant figures.
Asymptotic expansion at large values of the imaginary part of the argument
Here only the case of base is considered; although the generalization to the case is straghtforward. In this section, the bevavior of tetration is considered for moderate values of and large values of
At , in the upper halfplane, tetrationes approach the fixed point of the logarithm. This approach is exponential. Using the exponential
as a small parameter, for some complex constant , the tetration can be estimated as follows:
Substitution of this expression into the equation gives
Value can be found fitting the tetration
with function at large values of
. Then, the expansion can be written in the form
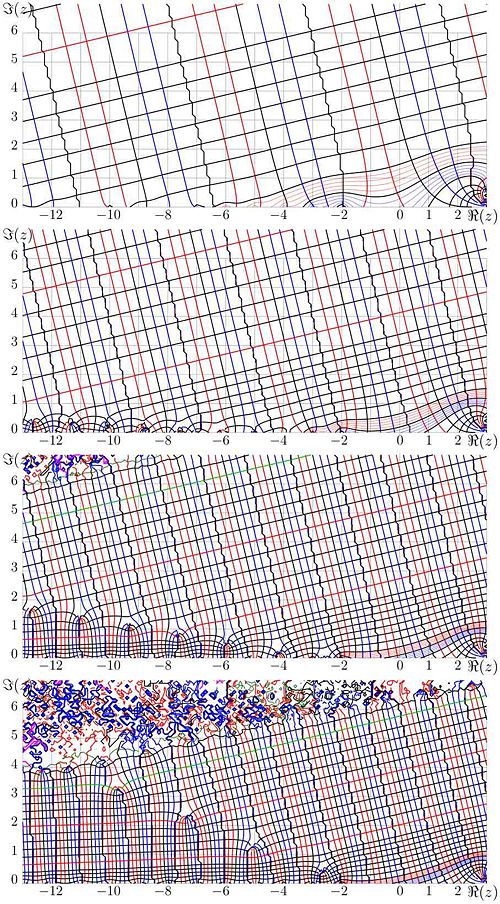
assuming that and . At given , such a representation indicates the possible approximations of tetration. The deviations of tetration from these approximations are shown in figure Fig.As.
The four plots in fig.As correspond to the four asymptotic approximations. The deviations
- ,
- ,
- ,
are shown in the complex plane with lines of constant phase and constant modulus.
- Levels are shown with thick red lines.
- Level is shown with thick black lines.
- Levels are shown with thick blue lines.
- Levels are shown with scratched lines. (these lines reveal the step of sampling used by the plotter).
- Levels are shown with thin red lines.
- Levels are shown with thin blue lines.
- Levels are shown with thin thick black lines.
- Level is shown with thick red line.
- Levels are shown with thick black lines.
- Level is shown with thick red line.
- Levels are shown with thick black lines.
- Level is shown with thick green line.
- Level is shown with thick black line.
The plotter tried to draw also
- Level with thick black line and
- Level with thin dark green line, which are seen a the upper left hand side corners of the two last pictures, but the precision of evaluation of tetration is not sufficient to plot the smooth lines; for the same reason, the curve for
- in the last picture, in the upper right band side looks a little bit irreguler; also, the pattenn in the upper left corner of the last two pictures looks chaotic; the plotter cannot distinguish the function from its asymptotic approximation.
The figure indicates that, at , , the asymptotic approximation
gives at least 14 correct significant figures. At large values of the imaginary part, this approximation is more precise than the evaluation of tetration through the contour integral.
Approximation of tetration with elementary functions
Due to recurrent relation , it is sufficient to approximate tetration in any vertical strip of unit with in the complex plane. Some of such approximations are suggested in [1]. In principle, the numerical approximation of tetration with implementation of the Cauchi integral with finite sums [1] also should be considered as appeoximation with elementary function. However for the practical evaluation of tetration, shorter expressions are more suitable. One of such approximation comes from the Taylor expansion of function . The subtraction of logarithm remove the closest singulatity that limits the radius of convergence of the Taylor series, and makes preciser the approcimation with finite sum. One of such appeoximation with one logarithm and polynomial of 100th power
is shown at the figure in the comples -plane. In vicinity of the origen of coordinates, say, , the most of terms are negligibly small, and the shortemed sum still approximates the tetration. The first coefficients in this expansion are
More coefficients can be extracted from the generator of the figure. While , the approximation with 101 terms returns at least 14 correct significant figures.
Approximation of slog
Function slog, which is inverse of tetration, allows the approximation with elementary functions.
Taylor expansion
The Taylor series for the tetration can be inverted, gaining the expansion of the superlogarithm:
- .
Approximations for the first 16 coefficients:
The partial sum with 16 terms (from zero to 16) is plotted in the figure in the complex plane. LInes of constant real part and constant imaginary part are drawn.
The radius of convergence of this series is determined by the distance to the closest singularity; the representation of with the Taylor series is valid for
Obviously, it fails at . For this case, the asymptotic expansion can be used.
Expansion at fixed point of logarithm
Superlogarithm can be approximated with expansion [8]
- ,
where is fixed point of logarithm. This expansion indicates the ways to construct the asymptotic approximations of slog. The coefficients can be expressed from the asymptotical analysis of equation . Also, they can be expressed from the asymptotical estimate of tetration at large values of the imaginary part of the argument. The evaluation of first coefficients gives
These coefficients allow to approximate slog in vicinity of the fixed point of logarithm with function
- .
In the figure this is shown in the compled -plane.
- Levels are shown with thick black lines.
- Levels are shown with thin red lines.
- Levels are shown with thin dark green lines.
- Levels is shown with thick green line.
(Deviation of this line from the real axis indicates the error of the approximation.)
- Level is shown with thick red line
- Levels are shown with thin dark blue lines lines.
For comparison, dashed lines show the precise evaluation for some of the levels above for the robust implementation of the slog function as inverse of tetration. While , the deviation of these dashed lines from the levels for function is not seen even at the strong zooming-in of the central part of the figure.
Approximation of slog with elementary functions
The precision of approximation of slog (with fixed precision of the arithmetics used for the tvaluation) can be extended, takung unto account the singularitues of slog at the fixed points. From the asumptotical representation above, one can guess the robust representation for slog:
The coefficients of this expansion are real. The first coefficients:
This representation allows construction of approximations, truncating the series. One of such approximations
is shown in figure in the complex plane. LInes of constant and those of constant are plotted.
The range of approximation of slog with this function is wider than that with the Taylor expasion at unity. The extended range of approcimation allows its validation with the numerical test of identities
The residuals
- and
are shown in the figure with levels const. In the voided regions in vicinity of and , the residual is at the level of . (It is difficult to make the residual smaller, using the arithmetics with double complex variables.) This test indicates, that at , the approximation of slog with two the logarithms and the polynomial of 50th power gives at least 9 correct significant figures.
Iterated exponential and
Pre-historic approach to the iterated exponential
Especially interesting is the case of iteration of natural exponential, id est, . Existence of the fractional iteration, and, in particular, existence of operation was demonstrated in 1950 by H.Kneser. [8]. However, that time, there was no computer facility for the evlauation of such an exotic function that ; perhaps, just absence of an apropriate plotter did not allow Kneser to plot the distribution of fractal exponential function in the complex plane for various values of , shown in Fig.9.
The Implementation through the tetration
Holomorphic tetration allows to extend the iterated exponential
For non-integer values of . It can be defined as
If in the notation the superscript is omitted, it is assumed to be unity; for example . If the subscript is omitted, it is assumed to be , id est,
Iterated exponential in the complex plane
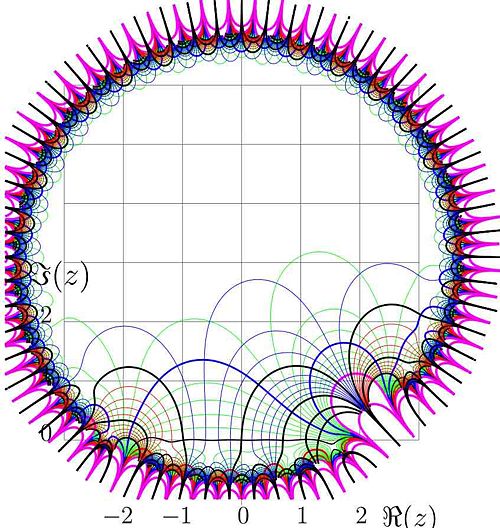
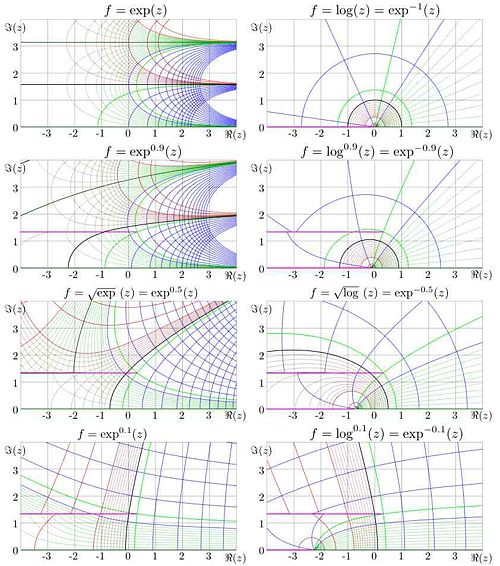
Function is shown in figure 9 with levels of constant real part and levels of constant imaginary part. Levels and are drown with thick lines. Red corresponds to a negative value of the real or the imaginaryt part, black corresponds to zero, and blue corresponds to the positeive values. Levels are shown with thin red lines. Levels are shown with thin green lines. Levels and Levels are marked with thick green lines, where is fixed point of logarithm. At non-integer values of , and are branch points of function ; in figure, the cut is placed parallel to the real axis. At there is an additional cut which goes along the negative part of the real axis. In the figure, the cuts are marked with pink lines.
Iterated exponential of a real argument
For real values of the argument, function is ploted in figure 10 versus for values
.
in programming languages, inverse function of exp is called log.
For logarithm on base e, notation ln is also used. In particular, , and so on.
At least for the real and big enough , the relation holds, which is qute analogous of relations and . However, at negative or negative , value should be big enough, that and and are defined, see figure 10. For example, at , we need . In particular, at , , we have .
Application of iterated exponential
The iterated exponential, that can be implemented with holomorphic tetration, may have various applications. In particular, The at could describe a process that grows faster than any polynomial, but slower than any exponential. In such a way, the iterated exponential, at the proper implementation, should greatley extend the abilities of fast and precise fitting of functions. This is just analogy of function which, at fractal values of , may be good for description of a function that grows faster than any linear function but slower than any quadratic function.
Similar functions
WIthdrowal of some of requirements from the definition of tetration allows the huge variety of similar functions.
Entire solutions of
Withdrowal of the requirement and allows the solution by Kneser [8], which is entire and also could be used to build up various powers of the exponential; in particular, . Such entire function is shown in upper part of figure 1c in [1], in order to reveal the asymptotic henavior of holomotphic tetration.
WIthdrowal of condition allows to construct solutions, similar to the growing tetration, for base . Although such solutions cannot be interpreted as generalization of exponential iterated times, they can be useful for generalization of exponential function.
Non-holomorphic modificaiton of tetration
WIthdrowal of requirement of holomorphicity from the definition of tetration allows functions, which look like the tetration, at least along the real axis. Even the reduction of the range of holomorphism in the requirement allows to consider tetration with modified argument. The modified tetration can be defined as
- ,
where , and is a 1-periodic function. The simple example of such such function is
In this case, along the real axis, the function is almost identical to its argument; and values of the modified tetration are close to values of tetration. Being plotted at figure 1 or in figure 10, the deviation of such function from the identity is small, and the deviation of the modified tetration from tetration is also small. If the figures are printed in the real scale, then the defiation of the curves would be of order of atomic size.
However the difference becomes seen at the complex values of the argument. In figure 11, function is plotted in the complex plane. Levels of constant real part and those of constant imajinary part are drawn. In vicinity of the real axis, these lines almost coincide with the gridline; the grid is drawn with step unity and extended one step to the right and one step to the left ftom the graphic. in order to show that it behaves as it if would be a continuation of the plot. At , the deviation from the identitcal function becomes visible, and at , the has many points with real values, including those with various negative integer values. The tetration has cut at negative values of and singularities there. Therefore, the cuts of the modified tetration are determined by the lines , and modified tetration unavoidable havs singulatities in points such that . These singulatities are determined by the function and do not depend on the base of tetration. In figure 11, the lines are seen not only along the real axis, but also at the top and at the bottom of the figure. In such a way, figure 11 shows the cutlines of the mofified tetration. One has no need to evaluate tetration in order to see the margin of the hange of holomorphism of the modified tetration.
In fugure 12, the modified tetration is plotted in the coplex -plane. The additional cuts are seen in the upper and lower parts of the figure 12. Only within the strip along the real axis, the function is holomorphic. While the amplitude of sinusoidal is of order of , the strip of holomorphism is wider than unity, although this sidth slightly reduces along the real axis.
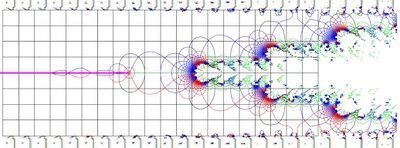
In order to see the behavior of the modified tetration in vivinity of the additional singularities, in fig.13, the sooming-in of the part of figure 12 is shown.The zoom has improved resolution, so, in its turn, it can be zoomed in to the size of the screen of a computer to see the details. In each cell of the grid, the small and deformed image of the central part of the fig.12 appears.
One has no need to evaluate tetration in order to reveal its singulatities outside the real azis. All the solutions of equation for integer are singularities (branchpoints) of the modified tetration.
Let .
The following theorem is suggested: For any entire 1-periodic function such that , is not a constant, , there exist .
Although this theorem is not yet proved, the intents to construct at least one example of function, that woud contradict it, were not successful. This theorem is somehow independent from the theory of tetration, but it indicates, that any modified tetration cannot be holomorphic in the range .
Assording to the theorem above, the modified tetration does not satisfy the condition of quasi-periodicity, and does not satisfy the criterion of holomorphism in the definition of tetration. The sequance of cutlines for the epecific example of mofidied tetration is seen in figure 13; the modified tetration is not even continuous. An addition to function smome highest sinusoidals brings the discontinuities even closer to the real axis. This indicates, that if in at least one point at the real axis between and , some solution of equations , differs from tetration tet for at least , then this solution is not holomorphic in the range .
Even small deformation of tetration tet breaks its continuity. Similar reasons in favor of uniqueness tetration are suggested also in [1]. There is only one tetration, that satisfies requirements of the definition, although the rigorous mathematical proof of the uniqueness is still under development.
References
- ↑ 1.0 1.1 1.2 1.3 1.4 1.5
D.Kouznetsov. (2009). "Solutions of in the complex plane.". Mathematics of Computation, 78: 1647-1670. DOI:10.1090/S0025-5718-09-02188-7. Research Blogging.
Cite error: Invalid
<ref>tag; name "k" defined multiple times with different content Cite error: Invalid<ref>tag; name "k" defined multiple times with different content Cite error: Invalid<ref>tag; name "k" defined multiple times with different content Cite error: Invalid<ref>tag; name "k" defined multiple times with different content Cite error: Invalid<ref>tag; name "k" defined multiple times with different content - ↑ 2.0 2.1 D.Kouznetsov. Ackermann functions of complex argument. Preprint of the Institute for Laser Science, UEC, 2008.
http://www.ils.uec.ac.jp/~dima/PAPERS/2008ackermann.pdf Cite error: Invalid
<ref>tag; name "k2" defined multiple times with different content - ↑ R.L.Goodstein (1947). "Transfinite ordinals in recursive number theory". Journal of Symbolic Logic 12.
- ↑ 4.0 4.1
P.Walker (1991). "Infinitely differentiable generalized logarithmic and exponential functions". Mathematics of computation 196: 723-733.
Cite error: Invalid
<ref>tag; name "w" defined multiple times with different content - ↑ M.H.Hooshmand. ”Ultra power and ultra exponential functions”. Integral Transforms and Special Functions 17 (8), 549-558 (2006)
- ↑ N.Bromer. Superexponentiation. Mathematics Magazine, 60 No. 3 (1987), 169-174
- ↑ W.Ackermann. ”Zum Hilbertschen Aufbau der reellen Zahlen”. Mathematische Annalen 99(1928), 118-133.
- ↑ 8.0 8.1 8.2
H.Kneser. “Reelle analytische L¨osungen der Gleichung und verwandter Funktionalgleichungen”.
Journal fur die reine und angewandte Mathematik, 187 (1950), 56-67. Cite error: Invalid
<ref>tag; name "kneser" defined multiple times with different content Cite error: Invalid<ref>tag; name "kneser" defined multiple times with different content


