Bode plot: Difference between revisions
imported>John R. Brews (→Highpass filter: sentence order) |
mNo edit summary |
||
| (10 intermediate revisions by 2 users not shown) | |||
| Line 1: | Line 1: | ||
{{subpages}} | {{subpages}} | ||
{{TOC|right}} | {{TOC|right}} | ||
A '''Bode plot''', named after [[Hendrik Wade Bode]], is a combination of a Bode magnitude plot and Bode phase plot, that shows the [[transfer function]] or [[frequency response]] of a [[LTI system theory|linear, time-invariant]] system using a log-frequency axis (frequency in powers of 10). | A '''Bode plot''', named after [[Hendrik Wade Bode]], is a combination of a Bode magnitude plot and Bode phase plot, that shows the [[transfer function]] or [[frequency response]] of a [[LTI system theory|linear, time-invariant]] system using a log-frequency axis (frequency in powers of 10). | ||
| Line 11: | Line 10: | ||
:<math>\ln \left( |A_1|e^{j\varphi_1}\ \cdot \ |A_2|e^{j\varphi_2}\right) </math> <math>= \ln \left(|A_1||A_2|\right) + \ln e^{j(\varphi_1+\varphi_2)} </math> <math>=\left(\ln|A_1|+ \ln|A_2|\right) +j(\varphi_1+\varphi_2)\ . </math> | :<math>\ln \left( |A_1|e^{j\varphi_1}\ \cdot \ |A_2|e^{j\varphi_2}\right) </math> <math>= \ln \left(|A_1||A_2|\right) + \ln e^{j(\varphi_1+\varphi_2)} </math> <math>=\left(\ln|A_1|+ \ln|A_2|\right) +j(\varphi_1+\varphi_2)\ . </math> | ||
That is, once the natural logarithms of the gain magnitudes are converted to dB, the Bode plot of the ''product'' is expressed by the two Bode plots: the ''sum'' of the Bode magnitude plots and the ''sum'' of the Bode phase plots. | That is, once the natural logarithms of the gain magnitudes are converted to dB,<ref name=note1 group=Note/> the Bode plot of the ''product'' is expressed by the two Bode plots: the ''sum'' of the Bode magnitude plots and the ''sum'' of the Bode phase plots. | ||
If the transfer function is a [[rational function]] with real poles and zeros, then the Bode plot can be approximated with straight lines. These asymptotic approximations sometimes are called '''straight-line Bode plots''', and sometimes simply Bode plots. They are obtained by breaking up the factors of a gain expression into simple products of pole and zero factors, and then replacing the accurate gain expressions for each factor using only asymptotic forms valid at very low and very high frequencies. These straight-line approximations to the Bode plots are included in the figures. | If the transfer function is a [[rational function]] with real poles and zeros, then the Bode plot can be approximated with straight lines. These asymptotic approximations sometimes are called '''straight-line Bode plots''', and sometimes simply Bode plots. They are obtained by breaking up the factors of a gain expression into simple products of pole and zero factors, and then replacing the accurate gain expressions for each factor using only asymptotic forms valid at very low and very high frequencies. These straight-line approximations to the Bode plots are included in the figures below. | ||
As an aside, system modifications seldom change the magnitude and phase Bode plots independently — changing the amplitude response of the system will most likely change the phase characteristics and ''vice versa''. Their interdependence is illustrated by the observation that the phase and amplitude characteristics can be obtained from each other for minimum-phase systems using the [[Hilbert transform]]. | As an aside, system modifications seldom change the magnitude and phase Bode plots independently — changing the amplitude response of the system will most likely change the phase characteristics and ''vice versa''. Their interdependence is illustrated by the observation that the phase and amplitude characteristics can be obtained from each other for minimum-phase systems using the [[Hilbert transform]]. | ||
| Line 64: | Line 63: | ||
:<math>20\ \mathrm{log_{10}} \mid A_{\mathrm{High}}(f) \mid \ =20\ \mathrm{log_{10}} \left( f/f_1 \right)</math> | :<math>20\ \mathrm{log_{10}} \mid A_{\mathrm{High}}(f) \mid \ =20\ \mathrm{log_{10}} \left( f/f_1 \right)</math> | ||
:::::::  <math>\ -20 \ \mathrm{log_{10}} \left( \sqrt{ 1 + (f/f_1)^2 }\right) \ . </math> | ::::::::  <math>\ -20 \ \mathrm{log_{10}} \left( \sqrt{ 1 + (f/f_1)^2 }\right) \ . </math> | ||
The phase is: | The phase is: | ||
| Line 87: | Line 86: | ||
The figure at right shows the Bode magnitude plot for a zero and a low-pass pole, and compares the two with the Bode straight line plots. The straight-line plots are horizontal up to the pole (zero) location and then drop (rise) at 20 dB/decade. The figure below does the same for the phase. The phase plots are horizontal up to a frequency a factor of ten below the pole (zero) location and then drop (rise) at 45°/decade until the frequency is ten times higher than the pole (zero) location. The plots then are again horizontal at higher frequencies at a final, total phase change of 90°. | The figure at right shows the Bode magnitude plot for a zero and a low-pass pole, and compares the two with the Bode straight line plots. The straight-line plots are horizontal up to the pole (zero) location and then drop (rise) at 20 dB/decade. The figure below does the same for the phase. The phase plots are horizontal up to a frequency a factor of ten below the pole (zero) location and then drop (rise) at 45°/decade until the frequency is ten times higher than the pole (zero) location. The plots then are again horizontal at higher frequencies at a final, total phase change of 90°. | ||
The Bode plot for a gain function that is the product of a pole and zero can be constructed by superposition, because the Bode plot is logarithmic, and the logarithm of a product of factors is sum of the individual, separate logarithms. The following two figures show how superposition (simple addition) of a pole and zero plot is done. The Bode straight line plots again are compared with the exact plots. The zero is assumed to reside at higher frequency than the pole to make a more interesting example. | The Bode plot for a gain function that is the product of a pole and zero can be constructed by superposition, because the Bode plot is logarithmic, and the logarithm of a product of factors is sum of the individual, separate logarithms. The following two figures show how superposition (simple addition) of a pole and zero plot is done. The Bode straight line plots again are compared with the exact plots. The zero is assumed to reside at higher frequency (1kHz) than the pole (100Hz) to make a more interesting example. | ||
Notice in the magnitude plot that the initial 20 dB/decade drop of the pole is arrested by the onset of the 20 dB/decade rise of the zero, resulting in a ''horizontal'' (zero-slope) magnitude plot for frequencies above the zero location. | Notice in the magnitude plot that the initial 20 dB/decade drop of the pole beyond 100Hz is arrested by the onset of the 20 dB/decade rise of the zero at 1kHz, resulting in a ''horizontal'' (zero-slope) magnitude plot for frequencies above the zero location. | ||
Notice in the bottom phase plot that the range of frequencies where the phase changes in the straight line plot is limited to frequencies a factor of ten above and below the pole (zero) location. Where the phase of the pole and the zero both are present, the straight-line phase plot is horizontal because the 45°/decade drop of the pole is arrested by the overlapping 45°/decade rise of the zero | Notice in the bottom phase plot that the range of frequencies where the phase changes in the straight line plot is limited to frequencies a factor of ten above and below the pole (zero) location. Where the phase of the pole and the zero both are present, the straight-line phase plot is horizontal because the 45°/decade drop of the pole is arrested by the overlapping 45°/decade rise of the zero. In the limited range of frequencies between 100 Hz and 1 kHz where both pole and zero are active contributors to the phase, the straight-line approximation is crude. | ||
==Gain margin and phase margin== | ==Gain margin and phase margin== | ||
| Line 98: | Line 97: | ||
::<math> A_{FB} = \frac {A_{OL}} {1 + \beta A_{OL}} \ , </math> | ::<math> A_{FB} = \frac {A_{OL}} {1 + \beta A_{OL}} \ , </math> | ||
where A<sub>FB</sub> is the gain of the amplifier with feedback (the '''closed-loop gain'''), β is the '''feedback factor''' and ''A''<sub>OL</sub> is the gain without feedback (the '''open-loop gain'''). The open-loop gain ''A''<sub>OL</sub> is a complex function of frequency, with both magnitude and phase. | where A<sub>FB</sub> is the gain of the amplifier with feedback (the '''closed-loop gain'''), β is the '''feedback factor''' and ''A''<sub>OL</sub> is the gain without feedback (the '''open-loop gain'''). The open-loop gain ''A''<sub>OL</sub> is a complex function of frequency, with both magnitude and phase. The product ''βA<sub>OL</sub>'' is called the '''loop gain''' and represents the gain beginning from the input and going around the feedback loop and back to the input. | ||
Examination of this relation shows the possibility of infinite gain if the product {{nowrap|β''A''<sub>OL</sub> <nowiki>=</nowiki> −1.}} When {{nowrap|β''A''<sub>OL</sub> <nowiki>=</nowiki> −1,}} a negative replica of the input is subtracted from the input by the negative feedback loop, which means we have a ''regenerative'' situation in which the input grows and grows. (That is, the magnitude of β''A''<sub>OL</sub> is unity and its phase is −180°, the so-called '''Barkhausen criteria''' for oscillation.<ref name=Bakshi/>) Bode plots are used to determine just how close an amplifier comes to satisfying this condition. | Examination of this relation shows the possibility of infinite gain if the product {{nowrap|β''A''<sub>OL</sub> <nowiki>=</nowiki> −1.}} When {{nowrap|β''A''<sub>OL</sub> <nowiki>=</nowiki> −1,}} a negative replica of the input is subtracted from the input by the negative feedback loop, which means we have a ''regenerative'' situation in which the input grows and grows. (That is, the magnitude of β''A''<sub>OL</sub> is unity and its phase is −180°, the so-called '''Barkhausen criteria''' for oscillation.<ref name=Bakshi/><ref name=Razavi/>) Bode plots are used to determine just how close an amplifier comes to satisfying this condition. | ||
Key to this determination are two frequencies. The first, labeled here as ''f''<sub>180</sub>, is the frequency where the open-loop gain flips sign. The second, labeled here ''f''<sub>0dB</sub>, is the frequency where the magnitude of the product | β ''A''<sub>OL</sub> | = 1 (in dB, magnitude 1 is 0 dB). That is, frequency ''f''<sub>180</sub> is determined by the condition: | Key to this determination are two frequencies. The first, labeled here as ''f''<sub>180</sub>, is the frequency where the open-loop gain flips sign. The second, labeled here ''f''<sub>0dB</sub>, is the frequency where the magnitude of the product | β ''A''<sub>OL</sub> | = 1 (in dB, magnitude 1 is 0 dB). That is, frequency ''f''<sub>180</sub> is determined by the condition: | ||
| Line 110: | Line 109: | ||
:::<math>| \beta A_{OL} \left( f_{0dB} \right) | = 1 \ . </math> | :::<math>| \beta A_{OL} \left( f_{0dB} \right) | = 1 \ . </math> | ||
One measure of proximity to instability is the '''gain margin'''. The Bode phase plot locates the frequency where the phase of β''A''<sub>OL</sub> reaches −180°, denoted here as frequency ''f''<sub>180</sub>. Using this frequency, the Bode magnitude plot finds the magnitude of β''A''<sub>OL</sub>. If |β''A''<sub>OL</sub>|<sub>180</sub> = 1, the amplifier is unstable, as mentioned. If |β''A''<sub>OL</sub>|<sub>180</sub> < 1, instability does not occur, and the separation in dB of the magnitude of |β''A''<sub>OL</sub>|<sub>180</sub> from |β''A''<sub>OL</sub>| = 1 is called the ''gain margin''. Because a magnitude of one is 0 dB, the gain margin is simply one of the equivalent forms: 20 log<sub>10</sub>( |β''A''<sub>OL</sub>|<sub>180</sub>) = 20 log<sub>10</sub>( |''A''<sub>OL</sub>|<sub>180</sub>) − 20 log<sub>10</sub>( 1 / β ). | One measure of proximity to instability is the '''gain margin'''.<ref name=note2 group=Note/> The Bode phase plot locates the frequency where the phase of β''A''<sub>OL</sub> reaches −180°, denoted here as frequency ''f''<sub>180</sub>. Using this frequency, the Bode magnitude plot finds the magnitude of β''A''<sub>OL</sub>. If |β''A''<sub>OL</sub>|<sub>180</sub> = 1, the amplifier is unstable, as mentioned. If |β''A''<sub>OL</sub>|<sub>180</sub> < 1, instability does not occur, and the separation in dB of the magnitude of |β''A''<sub>OL</sub>|<sub>180</sub> from |β''A''<sub>OL</sub>| = 1 is called the ''gain margin''. Because a magnitude of one is 0 dB, the gain margin is simply one of the equivalent forms: 20 log<sub>10</sub>( |β''A''<sub>OL</sub>|<sub>180</sub>) = 20 log<sub>10</sub>( |''A''<sub>OL</sub>|<sub>180</sub>) − 20 log<sub>10</sub>( 1 / β ). | ||
Another equivalent measure of proximity to instability is the '''phase margin'''. The Bode magnitude plot locates the frequency where the magnitude of |β''A''<sub>OL</sub>| reaches unity, denoted here as frequency ''f''<sub>0dB</sub>. Using this frequency, the Bode phase plot finds the phase of β''A''<sub>OL</sub>. If the phase of β''A''<sub>OL</sub>( ''f''<sub>0dB</sub>) > −180°, the instability condition cannot be met at any frequency (because its magnitude is going to be < 1 when ''f = f''<sub>180</sub>), and the distance of the phase at ''f''<sub>0dB</sub> in degrees above −180° is called the ''phase margin''. | Another equivalent measure of proximity to instability is the '''phase margin'''. The Bode magnitude plot locates the frequency where the magnitude of |β''A''<sub>OL</sub>| reaches unity, denoted here as frequency ''f''<sub>0dB</sub>. Using this frequency, the Bode phase plot finds the phase of β''A''<sub>OL</sub>. If the phase of β''A''<sub>OL</sub>( ''f''<sub>0dB</sub>) > −180°, the instability condition cannot be met at any frequency (because its magnitude is going to be < 1 when ''f = f''<sub>180</sub>), and the distance of the phase at ''f''<sub>0dB</sub> in degrees above −180° is called the ''phase margin''. | ||
| Line 141: | Line 140: | ||
{{Image|Gain margin.PNG|right|350px|Gain of feedback amplifier ''A''<sub>FB</sub> in dB and corresponding open-loop amplifier ''A''<sub>OL</sub>. The gain margin in this amplifier is 19 dB.}} | {{Image|Gain margin.PNG|right|350px|Gain of feedback amplifier ''A''<sub>FB</sub> in dB and corresponding open-loop amplifier ''A''<sub>OL</sub>. The gain margin in this amplifier is 19 dB.}} | ||
{{Image|Phase margin.PNG|right|350px|Phase of feedback amplifier ''A''<sub>FB</sub> in degrees and corresponding open-loop amplifier ''A''<sub>OL</sub>. The phase margin in this amplifier is 45°.}} | {{Image|Phase margin.PNG|right|350px|Phase of feedback amplifier ''A''<sub>FB</sub> in degrees and corresponding open-loop amplifier ''A''<sub>OL</sub>. The phase margin in this amplifier is 45°.}} | ||
The last two figures on the right illustrate the gain margin and phase margin for a different amount of feedback β. The feedback factor is chosen smaller than in previous borderline stable amplifier, moving | The last two figures on the right illustrate the gain margin and phase margin for a different amount of feedback β. The feedback factor is chosen smaller than in previous borderline stable amplifier, moving the condition {{nowrap|<nowiki>|</nowiki> β ''A''<sub>OL</sub> <nowiki>|</nowiki> <nowiki>=</nowiki> 1}} to the lower frequency of f<sub>0dB</sub> = 1 kHz. | ||
The upper of the two figures shows the gain plot. The intersection of {{nowrap|1 / β}} and ''A''<sub>OL</sub> occurs at {{nowrap|''f''<sub>0dB</sub> <nowiki>=</nowiki> 1 kHz.}} Notice that the peak in the gain ''A''<sub>FB</sub> near ''f''<sub>0dB</sub> seen in the borderline stable amplifier is almost gone.<ref name= | The upper of the two figures shows the gain plot. The intersection of {{nowrap|1 / β}} and ''A''<sub>OL</sub> occurs at {{nowrap|''f''<sub>0dB</sub> <nowiki>=</nowiki> 1 kHz.}} Notice that the peak in the gain ''A''<sub>FB</sub> near ''f''<sub>0dB</sub> seen in the borderline stable amplifier is almost gone.<ref name=note3 group=Note/><ref name=Sansen/> | ||
The lower of the two figures is the phase plot. Using the value of ''f''<sub>0dB</sub> = 1 kHz found above from the magnitude plot, the open-loop phase at ''f''<sub>0dB</sub> is −135°, which is a phase margin of 45° above −180°. | The lower of the two figures is the phase plot. Using the value of ''f''<sub>0dB</sub> = 1 kHz found above from the magnitude plot, the open-loop phase at ''f''<sub>0dB</sub> is −135°, which is a phase margin of 45° above −180°. | ||
Using the phase plot, for a phase of −180° the value of {{nowrap|''f''<sub>180</sub> <nowiki>=</nowiki> 3.332 kHz}} (the same result as found earlier, of course<ref name= | Using the phase plot, for a phase of −180° the value of {{nowrap|''f''<sub>180</sub> <nowiki>=</nowiki> 3.332 kHz}} (the same result as found earlier, of course<ref name=note4 group=Note/>). The open-loop gain from the gain plot at ''f''<sub>180</sub> is 58 dB, and {{nowrap|1 / β <nowiki>=</nowiki> 77 dB,}} so the gain margin is 19 dB. | ||
As an aside, it should be noted that stability is not the sole criterion for amplifier response, and in many applications a more stringent demand than stability is good [[Step_response#Step_response_of_feedback_amplifiers|step response]]. As a rule of thumb, good step response requires a phase margin of at least 45°, and often a margin of over 70° is advocated, particularly where component variation due to manufacturing tolerances is an issue.<ref name=Sansen2/> See also the discussion of phase margin in the [[Step_response#Phase_margin|step response]] article. | |||
==Notes== | |||
{{reflist|group=Note|refs= | |||
<ref name=note1 group=Note> | |||
Because | |||
:<math> A = e^{\ln A} \ ,</math> | |||
it follows that | |||
:<math> 20\log_{10} A =20 \log_{10}\left(e^{\ln A}\right) =\left(20 \log_{10} e \right)\ \ln A \ , </math> | |||
which provides the conversion factor from natural logarithms to decibels. | |||
</ref> | |||
<ref name=note2 group=Note> | |||
Ordinarily, as frequency increases the magnitude of the gain drops and the phase becomes more negative, although these are only trends and may be reversed in particular frequency ranges. Unusual gain behavior can render the concepts of gain and phase margin inapplicable. Then other methods such as the [[Nyquist plot]] have to be used to assess stability. | |||
</ref> | |||
==References | <ref name=note3 group=Note>The critical amount of feedback where the peak in the gain ''just'' disappears altogether is the ''maximally flat'' or [[Butterworth_filter#Maximal_flatness|Butterworth]] design. | ||
</ref> | |||
<ref name=note4 group=Note> | |||
The frequency where the open-loop gain flips sign ''f''<sub>180</sub> does not change with a change in feedback factor; it is a property of the open-loop gain. The value of the gain at ''f''<sub>180</sub> also does not change with a change in β. Therefore, we could use the previous values found for the borderline stable amplifier. However, for clarity the procedure is described using only the curves for the stable amplifier. | |||
</ref> | |||
}} | |||
==References== | |||
{{reflist|refs= | {{reflist|refs= | ||
<ref name=Bakshi> | <ref name=Bakshi> | ||
{{cite book |title=Electronic measurements and instrumentation |author=UA Bakshi, AV Bakshi, KA Bakshi |publisher=Technical Publications Pune |isbn=8184-31665-8 |year=2009 |chapter=§3.3.2 Barkhausen criterion |pages=pp. 3-5 – 3-7 |edition=2nd revised ed |url=http://books.google.com/books?id=utNfE7Rvpx4C&pg=SA3-PA5}} | {{cite book |title=Electronic measurements and instrumentation |author=UA Bakshi, AV Bakshi, KA Bakshi |publisher=Technical Publications Pune |isbn=8184-31665-8 |year=2009 |chapter=§3.3.2 Barkhausen criterion |pages=pp. 3-5 – 3-7 |edition=2nd revised ed |url=http://books.google.com/books?id=utNfE7Rvpx4C&pg=SA3-PA5}} | ||
</ref> | </ref> | ||
| Line 187: | Line 204: | ||
</ref> | </ref> | ||
<ref name= | <ref name=Razavi> | ||
{{cite book |author=Behzad Razavi |url=http://books.google.com/books?id=hl6JZ8DKlFwC&pg=PA483 |chapter=Figure 14.2: Evolution of oscillatory system with time |pages=p. 483 |isbn=9780072380323 |title=Design of analog CMOS integrated circuits |publisher=McGraw-Hill |year=2000}} | |||
</ref> | </ref> | ||
| Line 198: | Line 212: | ||
|author=Willy M C Sansen | |author=Willy M C Sansen | ||
|title=Analog design essentials | |title=Analog design essentials | ||
| | |chapter=Stability of operational amplifiers: §0517-§0527 | ||
|page=pp. 157-163 | |||
|year= 2006 | |year= 2006 | ||
|publisher=Springer | |publisher=Springer | ||
|location=Dordrecht, The Netherlands | |location=Dordrecht, The Netherlands | ||
|isbn=0-387-25746-2 | |isbn=0-387-25746-2 | ||
|url=http:// | |url=http://www.amazon.com/Essentials-Springer-International-Engineering-Computer/dp/0387257462#reader_0387257462}} | ||
</ref> | </ref> | ||
<ref name=Sansen2> | <ref name=Sansen2> | ||
{{cite book | {{cite book | ||
|author=Willy M C Sansen | |author=Willy M C Sansen | ||
|title=§0526 p. 162 | |title=Cited work | ||
|chapter=Stability of operational amplifiers: §0526 | |||
|pages=p. 162 | |||
|isbn=0-387-25746-2 | |isbn=0-387-25746-2 | ||
|url=http:// | |url=http://www.amazon.com/Essentials-Springer-International-Engineering-Computer/dp/0387257462#reader_0387257462}} | ||
</ref> | </ref> | ||
}}[[Category:Suggestion Bot Tag]] | |||
}} | |||
Latest revision as of 06:00, 20 July 2024
A Bode plot, named after Hendrik Wade Bode, is a combination of a Bode magnitude plot and Bode phase plot, that shows the transfer function or frequency response of a linear, time-invariant system using a log-frequency axis (frequency in powers of 10).
A Bode magnitude plot (also referred to as the Bode gain plot) is a graph of log magnitude versus frequency. The magnitude axis of the Bode plot is usually expressed as decibels, that is, 20 times the common logarithm (20 log10) of the amplitude of the gain.
A Bode phase plot is a graph of phase versus frequency, also plotted on a log-frequency axis, to evaluate how much a signal will be phase-shifted. Generally, the phase shift φ is a function of frequency.
The two Bode plots can be seen as separate plots of the real and the imaginary parts of the complex logarithm of a complex gain, say A(φ) = |A|ejφ. The Bode plot of a gain that is the product of two gains, A = A1A2 is thus:
That is, once the natural logarithms of the gain magnitudes are converted to dB,[Note 1] the Bode plot of the product is expressed by the two Bode plots: the sum of the Bode magnitude plots and the sum of the Bode phase plots.
If the transfer function is a rational function with real poles and zeros, then the Bode plot can be approximated with straight lines. These asymptotic approximations sometimes are called straight-line Bode plots, and sometimes simply Bode plots. They are obtained by breaking up the factors of a gain expression into simple products of pole and zero factors, and then replacing the accurate gain expressions for each factor using only asymptotic forms valid at very low and very high frequencies. These straight-line approximations to the Bode plots are included in the figures below.
As an aside, system modifications seldom change the magnitude and phase Bode plots independently — changing the amplitude response of the system will most likely change the phase characteristics and vice versa. Their interdependence is illustrated by the observation that the phase and amplitude characteristics can be obtained from each other for minimum-phase systems using the Hilbert transform.
Examples
To illustrate the method, a lowpass filter and a highpass filter example are presented, and then superposition, or summing of plots is illustrated using a product of a pole with a zero.
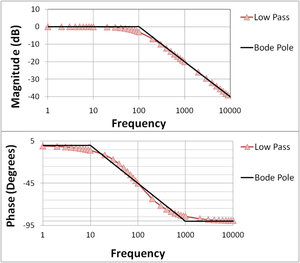
The Bode plot for a first-order (one-pole) lowpass filter; the straight-line approximations are labeled "Bode pole"; phase is 90° lower than for the highpass filter because the phase contribution of the numerator is 0° at all frequencies.
Lowpass filter
In the next figure, the Bode plots are shown for the one-pole lowpass filter function:
where f is the frequency in Hz, and f1 is the pole position in Hz, f1 = 100 Hz in the figure.
The lowpass adjective describes the unattenuated passage of low-frequency signals and the attenuation of high-frequency signals.
Using the rules for complex numbers, the magnitude of this gain expression is plotted on the Bode gain plot:
and ranges from A=1 at low frequencies to A=f1/f at high frequencies. On the Bode magnitude plot, decibels are used, and the plotted magnitude is:
The angle of the gain expression is plotted on the Bode phase plot:
and ranges from 0° at low frequencies to −tan−1(∞) = −90° at high frequencies. Care must be taken that the inverse tangent is set up to return degrees, not radians.
Straight-line approximation
The straight-line approximation to the lowpass Bode gain plot is arranged by using a zero-slope line obtained by setting f=0 in the gain expression (or A=1), and extending this line from f=0 to the corner frequency where roll-off begins, namely f=f1. At this point the gain expression is approximated by its expression for high frequencies, that is for f>>f1 (or A=−jf1/f), which leads to a straight line on the dB plot with a slope of −20dB/decade of frequency on the log-frequency scale.
For the phase plot the inverse tangent is approximated by three straight lines: one the angle of the low-frequency approximation to the gain, or 0°, extending from zero frequency to a frequency f1/10; another the angle of the high-frequency approximation to the gain, or −90°, extending from 10f1 to infinite frequency; and a third joining these two, a straight line with slope –45°/decade of frequency, crossing the angle –45° at f=f1.
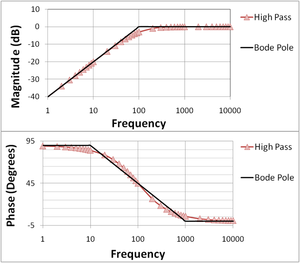
The Bode plot for a first-order (one-pole) highpass filter; the straight-line approximations are labeled "Bode pole"; phase varies from 90° at low frequencies (due to the contribution of the numerator, which is 90° at all frequencies) to 0° at high frequencies (where the phase contribution of the denominator is −90° and cancels the contribution of the numerator).
Highpass filter
In the figure at right, the Bode magnitude and phase plots are shown for a one-pole highpass filter function:
The magnitude of this complex function is
and ranges from A=f/f1 at low frequencies to A=1 at high frequencies. On the Bode magnitude plot, decibels are used, and the plotted magnitude is:
The phase is:
and ranges from 90° at low frequencies to 0° at high frequencies.
The adjective highpass refers to the behavior that high frequency signals are transferred unchanged, while low frequency signals are attenuated.
Straight-line approximation
The straight-line approximation to the highpass Bode gain plot is arranged by using a the low frequency approximation to the gain function (or A=jf/f1), a straight line on the dB plot with an upward slope of 20dB/decade of frequency, and extending this line from low frequencies to the corner frequency where roll-over begins, namely f=f1. At this point the gain expression is approximated by its expression for high frequencies , that is for f>>f1 (or A=1), which leads to a zero-slope line obtained by setting f=∞ in the gain expression.
For the phase plot the inverse tangent is approximated by three straight lines: one the angle of the low-frequency approximation to the gain, or 90°, extending from zero frequency to a frequency f1/10; another the angle of the high-frequency approximation to the gain, or 0°, extending from 10f1 to infinite frequency; and a third joining these two, a straight line with slope −45°/decade of frequency passing through the angle 45° at f=f1.
Product of pole and zero
The construction of Bode plots using superposition now is illustrated. To begin, the components are presented separately.
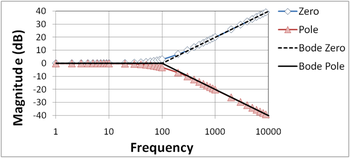
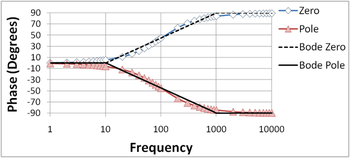
The figure at right shows the Bode magnitude plot for a zero and a low-pass pole, and compares the two with the Bode straight line plots. The straight-line plots are horizontal up to the pole (zero) location and then drop (rise) at 20 dB/decade. The figure below does the same for the phase. The phase plots are horizontal up to a frequency a factor of ten below the pole (zero) location and then drop (rise) at 45°/decade until the frequency is ten times higher than the pole (zero) location. The plots then are again horizontal at higher frequencies at a final, total phase change of 90°.
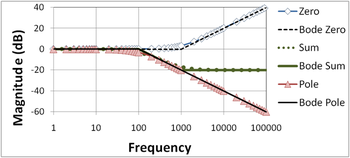
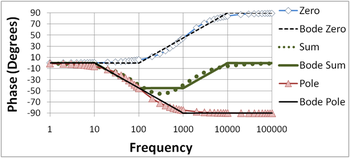
The Bode plot for a gain function that is the product of a pole and zero can be constructed by superposition, because the Bode plot is logarithmic, and the logarithm of a product of factors is sum of the individual, separate logarithms. The following two figures show how superposition (simple addition) of a pole and zero plot is done. The Bode straight line plots again are compared with the exact plots. The zero is assumed to reside at higher frequency (1kHz) than the pole (100Hz) to make a more interesting example.
Notice in the magnitude plot that the initial 20 dB/decade drop of the pole beyond 100Hz is arrested by the onset of the 20 dB/decade rise of the zero at 1kHz, resulting in a horizontal (zero-slope) magnitude plot for frequencies above the zero location.
Notice in the bottom phase plot that the range of frequencies where the phase changes in the straight line plot is limited to frequencies a factor of ten above and below the pole (zero) location. Where the phase of the pole and the zero both are present, the straight-line phase plot is horizontal because the 45°/decade drop of the pole is arrested by the overlapping 45°/decade rise of the zero. In the limited range of frequencies between 100 Hz and 1 kHz where both pole and zero are active contributors to the phase, the straight-line approximation is crude.
Gain margin and phase margin
Bode plots are used to assess the stability of negative feedback amplifiers by finding the gain and phase margins of an amplifier. The notion of gain and phase margin is based upon the gain expression for a negative feedback amplifier given by
where AFB is the gain of the amplifier with feedback (the closed-loop gain), β is the feedback factor and AOL is the gain without feedback (the open-loop gain). The open-loop gain AOL is a complex function of frequency, with both magnitude and phase. The product βAOL is called the loop gain and represents the gain beginning from the input and going around the feedback loop and back to the input.
Examination of this relation shows the possibility of infinite gain if the product βAOL = −1. When βAOL = −1, a negative replica of the input is subtracted from the input by the negative feedback loop, which means we have a regenerative situation in which the input grows and grows. (That is, the magnitude of βAOL is unity and its phase is −180°, the so-called Barkhausen criteria for oscillation.[1][2]) Bode plots are used to determine just how close an amplifier comes to satisfying this condition.
Key to this determination are two frequencies. The first, labeled here as f180, is the frequency where the open-loop gain flips sign. The second, labeled here f0dB, is the frequency where the magnitude of the product | β AOL | = 1 (in dB, magnitude 1 is 0 dB). That is, frequency f180 is determined by the condition:
where vertical bars denote the magnitude of a complex number (for example, | a + j b | = [ a2 + b2]1/2 ), and frequency f0dB is determined by the condition:
One measure of proximity to instability is the gain margin.[Note 2] The Bode phase plot locates the frequency where the phase of βAOL reaches −180°, denoted here as frequency f180. Using this frequency, the Bode magnitude plot finds the magnitude of βAOL. If |βAOL|180 = 1, the amplifier is unstable, as mentioned. If |βAOL|180 < 1, instability does not occur, and the separation in dB of the magnitude of |βAOL|180 from |βAOL| = 1 is called the gain margin. Because a magnitude of one is 0 dB, the gain margin is simply one of the equivalent forms: 20 log10( |βAOL|180) = 20 log10( |AOL|180) − 20 log10( 1 / β ).
Another equivalent measure of proximity to instability is the phase margin. The Bode magnitude plot locates the frequency where the magnitude of |βAOL| reaches unity, denoted here as frequency f0dB. Using this frequency, the Bode phase plot finds the phase of βAOL. If the phase of βAOL( f0dB) > −180°, the instability condition cannot be met at any frequency (because its magnitude is going to be < 1 when f = f180), and the distance of the phase at f0dB in degrees above −180° is called the phase margin.
If a simple yes or no on the stability issue is all that is needed, the amplifier is stable if f0dB < f180. This criterion is sufficient to predict stability only for amplifiers satisfying some restrictions on their pole and zero positions (minimum phase systems). Although these restrictions usually are met, if they are not another method must be used, such as the Nyquist plot.[3][4]
Examples using Bode plots
Two examples illustrate gain behavior and terminology. For a three-pole amplifier, gain and phase plots for a borderline stable and a stable amplifier are compared. These considerations also affect the amplifier step response.
Because the feedback amplifier does not have only real poles and zeroes, the straight-line Bode plot approximation does not work for the case with feedback.
Borderline stable amplifier
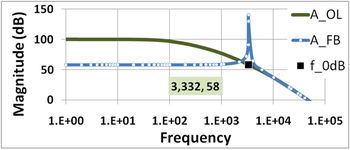
The first of two figures at the right compares the Bode plots for the gain without feedback (the open-loop gain) AOL with the gain with feedback AFB (the closed-loop gain). See negative feedback amplifier for more detail.
Because the open-loop gain AOL is plotted and not the product β AOL, the condition AOL = 1 / β (approximately 58 dB in this example) decides the frequency where βAOL = 1, that is the frequency labeled f0dB (about 3.332 kHz in this example). The feedback gain at low frequencies and for large loop gain is AFB ≈ 1 / β:
for the case of large loop gain βAOL. So, an equivalent way to find f0dB is to look where the low-frequency asymptote to the feedback (or closed-loop) gain intersects the open-loop gain. (Frequency f0dB is needed later to find the phase margin.)
Near the crossover of the two gains at f0dB, the Barkhausen criterion is almost satisfied in this example, and the feedback amplifier exhibits a massive peak in gain (it would be infinity if β AOL = −1). Beyond the unity gain frequency f0dB, the open-loop gain is sufficiently small that AFB ≈ AOL (examine the formula at the beginning of this section for the case of small AOL).
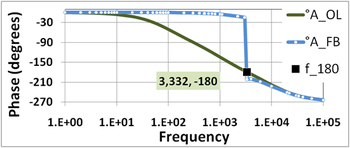
The second of the two figures shows the corresponding phase comparison: the phase of the feedback amplifier is nearly zero out to the frequency f180 where the open-loop gain has a phase of −180°. In this vicinity, the phase of the feedback amplifier plunges abruptly downward to become almost the same as the phase of the open-loop amplifier. (Recall, AFB ≈ AOL for small AOL.)
Comparing the labeled points in these two figures, it is seen that the unity gain frequency f0dB and the phase-flip frequency f180 are very nearly equal in this amplifier, f180 ≈ f0dB ≈ 3.332 kHz, which means the gain margin and phase margin are nearly zero. The amplifier is borderline stable.
Stable example
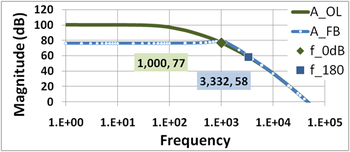
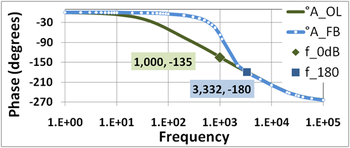
The last two figures on the right illustrate the gain margin and phase margin for a different amount of feedback β. The feedback factor is chosen smaller than in previous borderline stable amplifier, moving the condition | β AOL | = 1 to the lower frequency of f0dB = 1 kHz.
The upper of the two figures shows the gain plot. The intersection of 1 / β and AOL occurs at f0dB = 1 kHz. Notice that the peak in the gain AFB near f0dB seen in the borderline stable amplifier is almost gone.[Note 3][5]
The lower of the two figures is the phase plot. Using the value of f0dB = 1 kHz found above from the magnitude plot, the open-loop phase at f0dB is −135°, which is a phase margin of 45° above −180°.
Using the phase plot, for a phase of −180° the value of f180 = 3.332 kHz (the same result as found earlier, of course[Note 4]). The open-loop gain from the gain plot at f180 is 58 dB, and 1 / β = 77 dB, so the gain margin is 19 dB.
As an aside, it should be noted that stability is not the sole criterion for amplifier response, and in many applications a more stringent demand than stability is good step response. As a rule of thumb, good step response requires a phase margin of at least 45°, and often a margin of over 70° is advocated, particularly where component variation due to manufacturing tolerances is an issue.[6] See also the discussion of phase margin in the step response article.
Notes
- ↑
Because
- ↑ Ordinarily, as frequency increases the magnitude of the gain drops and the phase becomes more negative, although these are only trends and may be reversed in particular frequency ranges. Unusual gain behavior can render the concepts of gain and phase margin inapplicable. Then other methods such as the Nyquist plot have to be used to assess stability.
- ↑ The critical amount of feedback where the peak in the gain just disappears altogether is the maximally flat or Butterworth design.
- ↑ The frequency where the open-loop gain flips sign f180 does not change with a change in feedback factor; it is a property of the open-loop gain. The value of the gain at f180 also does not change with a change in β. Therefore, we could use the previous values found for the borderline stable amplifier. However, for clarity the procedure is described using only the curves for the stable amplifier.
References
- ↑ UA Bakshi, AV Bakshi, KA Bakshi (2009). “§3.3.2 Barkhausen criterion”, Electronic measurements and instrumentation, 2nd revised ed. Technical Publications Pune, pp. 3-5 – 3-7. ISBN 8184-31665-8.
- ↑ Behzad Razavi (2000). “Figure 14.2: Evolution of oscillatory system with time”, Design of analog CMOS integrated circuits. McGraw-Hill, p. 483. ISBN 9780072380323.
- ↑ Thomas H. Lee (2004). The design of CMOS radio-frequency integrated circuits, Second Edition. Cambridge UK: Cambridge University Press. ISBN 0-521-83539-9.
- ↑ William S Levine (1996). The control handbook: the electrical engineering handbook series, Second Edition. Boca Raton FL: CRC Press/IEEE Press. ISBN 0849385709.
- ↑ Willy M C Sansen (2006). “Stability of operational amplifiers: §0517-§0527”, Analog design essentials. Dordrecht, The Netherlands: Springer. ISBN 0-387-25746-2.
- ↑ Willy M C Sansen. “Stability of operational amplifiers: §0526”, Cited work, p. 162. ISBN 0-387-25746-2.


