File:Global Carbon Emission by Type to Y2004.png
Global_Carbon_Emission_by_Type_to_Y2004.png (555 × 493 pixels, file size: 58 KB, MIME type: image/png)
| Description |
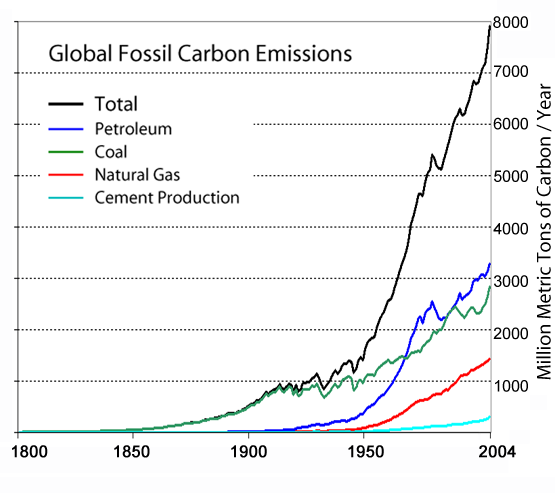
Español: Emisiones globales de dióxido de carbono discriminadas según su origen.
English: Global annual fossil fuel carbon dioxide emissions through year 2004, in million metric tons of carbon, as reported by the Carbon Dioxide Information Analysis Center [1]. |
||
| Date | |||
| Source |
This figure is original and was prepared for Commons by Mak Thorpe using data from available at thisUS Department of Energy web page (Archived at 2008-05-08T06:07:13).
Excel was used on the CSV file data to recreate a graph with the same format as the earlier version with older data to year 2000 created for the Global Warming Art project by Robert A. Rohde. |
||
| Author | Mak Thorpe | ||
| Permission (Reusing this file) |
Mak Thorpe, the copyright holder of this work, hereby publishes it under the following licenses: This file is licensed under the Creative Commons Attribution-Share Alike 3.0 Unported, 2.5 Generic, 2.0 Generic and 1.0 Generic license. Attribution: Mak Thorpe
You may select the license of your choice. |
||
| Other versions |
Older version with data thru 2000: Image:Global Carbon Emission by Type.png Image:Global Carbon Emission by Type to Y2004_ru.png |


|
File:Global Carbon Emissions.svg is a vector version of this file. It should be used in place of this PNG file when not inferior.
File:Global Carbon Emission by Type to Y2004.png → File:Global Carbon Emissions.svg
For more information, see Help:SVG. |
 |
Notes
The data is originally presented in terms of solid (e.g. coal), liquid (e.g. petroleum), gas (i.e. natural gas) fuels, and separate terms for cement production and gas flaring (i.e. natural gas lost during oil and gas mining). Unlike the year 2000 graph, the gas flaring (the smallest of all categories) was not added to the total for natural gas. Note that the carbon dioxide releases from cement production result from the thermal decomposition of limestone into lime, and so technically are not a fossil fuel source.
Related figures
-
 Total global carbon emissions, logarithmic scale.
 -
 Carbon dioxide emissions by region, linear scale.
 -
 Carbon dioxide concentrations during the last 400 thousand years.
 -
 Recent carbon dioxide concentrations measured at Mauna Loa.


File history
Click on a date/time to view the file as it appeared at that time.
| Date/Time | Thumbnail | Dimensions | User | Comment | |
|---|---|---|---|---|---|
| current | 10:57, 8 March 2008 | | 555 × 493 (58 KB) | imagescommonswiki>Makthorpe | {{Information |Description= {{es|Emisiones globales de dióxido de carbono discriminadas según su origen.}} Global annual fossil fuel carbon dioxide emissions through year 2004, in million [[w:metric ton|metric ton] |
File usage
The following file is a duplicate of this file (more details):
- File:Global Carbon Emission by Type to Y2004.png from Wikimedia Commons
There are no pages that use this file.